
An Example of An Accurate Hooke’s Law Laboratory
Table of Contents
Learning Objectives
- Gain confidence and experimental care in making accurate measurements.
- Understand the relationship between force and spring stretch.
- Use a neat and orderly lab notebook in which data are recorded.
- Execute a specific experimental procedure to test a specific hypothesis.
- Analyze the acquired data with a spreadsheet and graphing program to test the hypothesis.
- Explain in one’s own words whether the experimental data supported the hypothesis.
Introduction
Robert Hooke was a 17th-century scientist who made notable discoveries in a wide range of fields from astronomy to biology (discovery of the cell). His discovery of the linear relationship between the extension of a spring and the applied force has broad application in engineering and physics because it has been shown to apply in a wide array of circumstances for sufficiently small displacements. Most of Hooke’s discoveries resulted from careful observations and measurements.
Hypothesis: Spring stretch and applied force are linearly related. This hypothesis can be tested by hanging known masses (which create known downward forces) to a spring and measuring the resulting displacements. The slope of the line from plotting Force (in N) vs. position (in m) is a characteristic of the spring known as the spring constant (in units of N/m).
Note, that Hooke’s law is most commonly expressed as a direct proportionality between force and spring stretch. However, many simple coil springs are wound such that the coils physically prevent the spring from contracting all the way to the true unstretched position that would correspond to zero displacements for zero applied force. Consequently, it takes some finite applied force to overcome the resulting internal tension and produce a measurable displacement. To accommodate these springs, it is convenient to frame the hypothesis as a linear relationship rather than a direct proportion. This also allows students to simply record the position for each hanging weight rather than computing the displacement from the position corresponding to zero hanging weight.
Method
Materials
* A spring that has a significant and easily measurable stretch with the available masses. Here, a composite spring is constructed from 3 #84 springs arranged in series. These springs were purchased at an Ace hardware store.
* Electronic balance (if masses are unknown).
* A range of test masses (6-8) that can be hung to stretch the spring. Masses should have a range of values so that the heaviest mass is 3-4 times the lightest mass, and the range has (approximately) equal steps over the interval.
* A rigid hook, bar, rod, or other support from which spring may be suspended as masses are hung.
* A ruler, meter stick, or another length scale that may be hung vertically and rigidly behind the stretched spring for accurately measuring the position of the lower end of the stretched spring. Easy to read 1 mm tic marks are preferable.
* A lab notebook for recording data.
* A computer, plotting program, and spreadsheet for analyzing data.
Procedure for Experiment
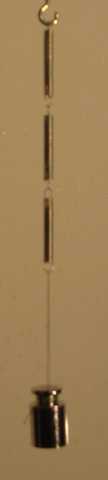
Prepare a page in your lab notebook with two columns. The first column is the hanging mass (in grams). The second column is the position of the lowest edge of the spring (in mm). The number of rows should correspond with the number of hanging masses (between six and eight). Set up your spring as shown in the figure to the left. The spring should be hung from rigid support that does not move as masses are applied. There needs to be a length scale behind the stretched spring for determining the spring position for each of a range of applied masses. If masses are not known, they need to be determined and recorded using the electronic balance.
Beginning with the lightest mass, hang each mass in turn from the spring. As each mass is hung, dampen the motion as best you can with your hand until the motion stops or becomes small enough that an accurate position measurement can be made. Record the position of the lowest portion of the spring in a table on the line corresponding to the mass. It is important to use the same part of the spring for this position measurement. The figure below shows the measurement for the spring position in our lab for the 150 g mass. Note some effort was taken to align the camera looking horizontally at the bottom spring coil for an accurate measurement.
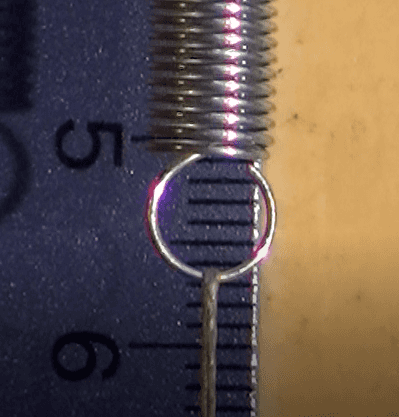
Likewise, it is essential to position your eye looking as near as possible to exactly horizontal when making the position measurement. Looking slightly upward or downward when lining up the position of the spring coil with the position scale will introduce parallax error. Repeat this measurement for each of your test masses until the table in your lab notebook is complete.
Procedure for Analysis
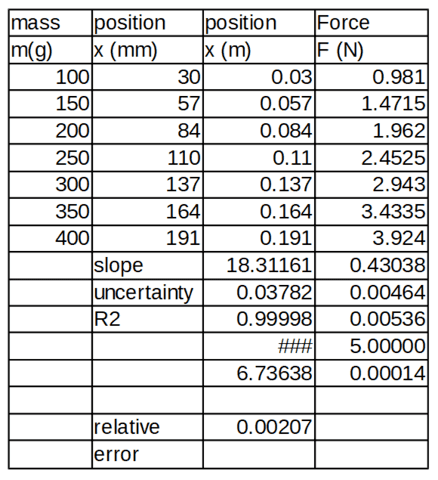
Make four columns in a spreadsheet with headings of Mass (g), Position (mm), Position (m), and Force (N). The first two columns contain the numbers for your original measurements, exactly the same as they are recorded in your lab notebook. The third column contains the position converted to meters with an appropriate spreadsheet formula, something like = B3/1000 (assuming the position in mm was in cell B3). The fourth column computes the applied force for each given mass, with a spreadsheet formula something like = A3*9.81/1000 (assuming the mass in g was in spreadsheet cell A3).
Now, copy the third and fourth columns for Position (m) vs. Force (N) (data only, no headers) into Graph.exe (downloadable for free from https://www.padowan.dk/download/ ) or other suitable graphing program and make a scatter plot of the data. Adjust the level of zoom as needed and take care to properly label the horizontal (x) axis as Position (m) and the vertical (y) axis as Force (N). You may also make other aesthetic adjustments to improve the appearance of the graph. Now, use the trendline menu option to insert a linear trendline. Do not check the box setting the y-intercept to zero. Make aesthetic adjustments to improve the appearance of the graph. Save your work as a graph file. Now, you may also save the graph as an image so that it can be imported into your lab report later. The slope of the trendline provides an accurate estimate of the spring constant, k, of your spring. It has units of N/m (newtons per meter) and is a characteristic of the spring.
Figure: Force vs. position for our Hooke’s law experiment, along with the best fit line.
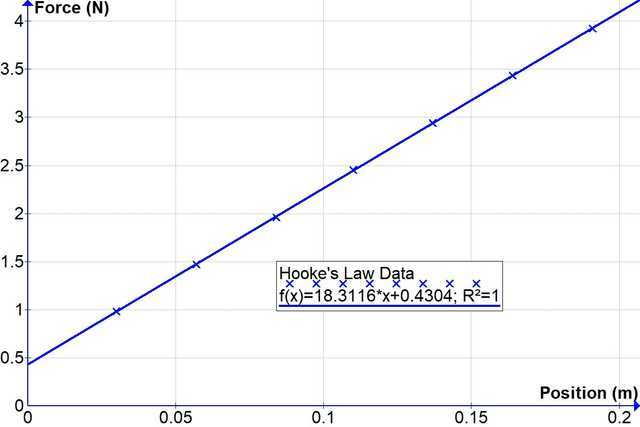
NOTE TO TEACHERS: The instructions above are a compromise to obtain the spring constant directly as the slope of the best fit line. Some teachers prefer to teach their labs always plotting the dependent variable on the vertical axis. If you prefer students to plot position vs. Force (position on the vertical axis), the slope of the best fit line will yield the reciprocal of the spring constant (in m/N), and an additional calculation will be needed to compute the spring constant. This approach is also more rigorous statistically since the least-squares method works better with smaller uncertainties in the x variable. (In this experiment, the applied forces probably have smaller errors than the measured positions.)
Now, the fancy stuff. Enter the LINEST spreadsheet call to repeat the least-squares fit in the spreadsheet. Something like =LINEST(D3:D9, C3:C9,1,1) in a cell in column C with plenty of room below and in the D column next to it. Hit CTRL-SHIFT-ENTER rather than just ENTER. This will make the full array of output visible rather than just one element. Several elements that are output will have important interpretations that are noted in the table.
Label resulting cells appropriately as slope, uncertainty, and R^2 (R squared) as shown in the table. Then compute the relative uncertainty in the spring constant (slope) as the ratio of the uncertainty to the slope and label it appropriately.
The rationale for Extended Analysis
The goal of low-cost quality experiments tends to put more of the burden on the analysis side than on the experiment side because most people have already invested in computers and the analysis software can be obtained for free. Further, extended and careful analysis is excellent training in scientific thinking, builds skills that will be useful in college, and reinforces skills that will increase scores on standardized tests like the ACT. Don’t give the analysis efforts short shrift. These tools and techniques will be used often and careful attention to these details is essential preparation for later laboratories.
Results (50 points total)
Your results should a well ordered and labeled table (15 points), as well as a figure (15 points) with the trendline and data produced in a graphing program. The above figure and table are illustrative examples, but it is essential that yours are created with your own original data. Pay attention to formatting and communication. The Table needs to be properly captioned and should also have a paragraph of text (10 points) describing its contents, but saving discussion relative to the hypothesis for the discussion section. Pay careful attention to include all the specific accuracy estimates in your table that are shown below. These are important in the discussion of whether the hypothesis is supported, and the uncertainty in the spring constant may also be important in later lab testing predictions for the period of simple harmonic oscillators. The Figure also needs to be properly captioned and should be described in a paragraph of text (10 points).
Table 1: Data and analysis for Force vs. Position for our Hooke’s Law experiment.
Discussion (50 Points)
Your written discussion should be from 1 to 3 paragraphs discussing the following questions in complete sentences:
* Was your hypothesis supported? Why or why not? (20 points)
* What was the relative uncertainty of your spring constant? (10 points)
* Other than the accuracy of the electronic balance, what else may have caused variations in your measurements? (10 points)
* Can you say your hypothesis was proven (or disproven)? Or is it better to say supported (or unsupported)? (10 points)
Note on lesson plans:
Teachers should consider a multi-day approach to this lab. Day 1: Discuss the theoretical background and read the lab instructions. Day 2: Perform the experiment. Day 3 (possible homework): Analyze the data. Day 4 (best as homework): Write lab report. A good lab science course uses 30-40% of class time on lab activities and completes at least 15 different lab experiments in a school year.
I grew up working in bars and restaurants in New Orleans and viewed education as a path to escape menial and dangerous work environments, majoring in Physics at LSU. After being a finalist for the Rhodes Scholarship I was offered graduate research fellowships from both Princeton and MIT, completing a PhD in Physics from MIT in 1995. I have published papers in theoretical astrophysics, experimental atomic physics, chaos theory, quantum theory, acoustics, ballistics, traumatic brain injury, epistemology, and education.
My philosophy of education emphasizes the tremendous potential for accomplishment in each individual and that achieving that potential requires efforts in a broad range of disciplines including music, art, poetry, history, literature, science, math, and athletics. As a younger man, I enjoyed playing basketball and Ultimate. Now I play tennis and mountain bike 2000 miles a year.


You mention downloading a graphing program. An alternate suggestion is just train the students to use Excel’s x-y scatter plot. You have the option to “add trend line” and display the equation of the trend line on the graph. Along with correlation coefficient indicating “goodness of fit”. Probably also helpful for students to know about the array formula “linest”. I might sound a bit like a Microsoft salesman here but I have found Excel a great “all in one” tool for data analysis generally.
This is a great introductory Science prac – many thanks for your insights article.
Pick any functional form, and any data, and there exists a best fit. This is the basis of politically motivated “science”.Sure, but in teaching science we can do better. We can have an honest look at how well a hypothetical functional form "fits" the data – R2, residuals, p-values, and so on. Not that every intro lab needs it, but most intro courses would do well to have several labs where students are required to compare their residuals to their instrumental accuracy. Most intro courses would also do well to have a few labs where students fit alternate functional forms to their data. If a power law, square root, quadratic, or exponential fits the data better than a straight line, what does this say about the hypothesis that predicted a linear fit? These data analysis steps help students see beyond their possible confirmation bias if only the hypothetical model is tried. It also gives students experience and analysis tools to help them see through "junk science."
Pick any functional form, and any data, and there exists a best fit. This is the basis of politically motivated “science”.
That's why I like the way we run our class here. We basically used the concept of "Studio Physics", where we really do not have an assigned session for "labs". Rather, the lab is considered as part of the lesson, where I often stop discussing the material and let the students check out something that is relevant to the topic. This works especially well when we do Lenz's law, where everyone has a bar magnet, a galvanometer, and a solenoid. I actually let them discover the property themselves as we go through various combinations of the magnet going in and out of the solenoid.
And since writing ability is included as part of our Syllabus, the students had to find the most accurate way to describe what they learned and to try to come up with a "rule" of what would happen under any circumstances.
But coming back to the non-Hooke's law experiment, during our class session, I had some of the best in-class discussion among the students based on this part of the experiment. It sets up perfectly for the rest of the semester what is expected out of the students, and they get a very early wake-up call that this is not going to be your normal, boring "labs". Even if they don't learn anything else, that realization by itself is worth doing this experiment.
Zz.
I think you missed my scenario. I included a non-Hooke's law spring. I didn't say that that was the only spring that the students were given. They were given 2 springs to find the spring constant. One was straight-up Hooke's law behavior. The other was not.I caught your scenario. The next lab (immediately after Hooke's law) in my lab course is usually the simple harmonic oscillator, where the hypothesis is basically the formula for the SHO period, using the previously measured spring constant. Using Tracker as the timer and timing 10 periods usually yields an accuracy comparable to that of k in the original experiment for linear springs. Of course, this hypothesis will not be supported for a non-linear spring.
Since my labs are designed for 1 hour experiments, there is insufficient time to do multiple springs. But with a long enough class period, one could keep the fun going by having students perform the SHO experiment with the same set of springs as used in the Hooke's law experiment.
But the whole propensity to allow students to "eyeball" whether data is linear feeds their disposition to conclude data is linear when it really is not. Even high school students can learn how R-Squared and the uncertainty in the slope can be used to determine that one spring is a lot less linear than the other. If one has an estimate on the uncertainty in k, students can see how the SHO formula for period becomes a garbage in – garbage out exercise for the non-linear spring. A careful experiment with a linear spring can yield a 1% or better uncertainty in k, which can yield a 1% or so support for the SHO period formula. The uncertainty in k for a nonlinear spring is going to be much larger.
Good point. A well designed lab course should include a number of cases where the hypothesis is not supported. But I prefer to put most of these later in the semester for several reasons:
1. Students tend to ascribe the lack of experimental support for a hypothesis to human or experimental error. I design most earlier labs to develop skills and build confidence in measurement accuracy to empower them to consider the possibility that the hypothesis might simply be wrong.
2. In cases like Hooke's law, the rule is more important than the exceptions for downstream courses. I would only present an experimental exception after the rule has been verified. There is probably time for cases that include both the rule and exceptions to Hooke's law in a 3 hour college lab once students are reasonably skilled and efficient. But this is unlikely in most 1 hour high school physics and physical science classes.
3. If a hypothesis will not be supported, I like students to have built enough analysis skills to suggest a different hypothesis. At some point in a lab course, students will be familiar with the most common functional forms: linear, quadratic, power law, square root, etc. and will have tested various data sets against multiple possibilities. If one hypothesis is not supported (such as a linear relationship), it is nice if students can explore other possibilities and suggest an alternative hypothesis from their data.I think you missed my scenario. I included a non-Hooke's law spring. I didn't say that that was the only spring that the students were given. They were given 2 springs to find the spring constant. One was straight-up Hooke's law behavior. The other was not.
Whatever the situation, we have sit back and figure out what we are trying to accomplish here. Our Syllabus for this class includes training the students with the skills and ability to perform experiments and analyze data, including systematic and analytical evaluation of experimental results. So seeing them respond to something that was completely unexpected is part of it. I made it a point to discuss this situation when I return their lab reports.
Here's the thing. If they were walking down the street, and I show them a random graph that looks like the non-Hooke's law graph, none of then would say that the straight line is a good representation of the data. Yet, many of them seem to throw out this sensibility when they walk into a physics class! I want them to learn (often, the hard way) that they need to bring that sensibility into the physics classroom, and that just because we are learning physics, it doesn't mean that all their worldly experiences no longer apply.
I find that they learn more when they make the mistake without my warning them first, rather than if I talk till I'm blue about it before hand.
Zz.
You may not believe it, but part of my Hooke's law experiment that I gave to my students were DESIGNED to not work "as expected". I gave them springs that had been abused and no longer exhibit the linear behavior, but I never told them that. Looking at the F versus x graph will show that this wonky spring did not show the same behavior as the Hooke's law spring.
You'd be surprised how many students IGNORED this, and blindly fit a straight line to something that clearly could not be accurately represented by a straight line.
Part of doing an experiment is the ability to handle things when something unexpected happens. You cannot be oblivious to what the data are telling you and simply forced it into ways that you expect them to be, or if there was something weird going on that may be attributed to error in the measurement or setup. I repeatedly have told to my students that they can get away with getting unexpected result and still get very good grade for the lab report, IF they are able to account for the strange result and were cognizant to the fact that something unexpected was obtained.
Zz.Good point. A well designed lab course should include a number of cases where the hypothesis is not supported. But I prefer to put most of these later in the semester for several reasons:
1. Students tend to ascribe the lack of experimental support for a hypothesis to human or experimental error. I design most earlier labs to develop skills and build confidence in measurement accuracy to empower them to consider the possibility that the hypothesis might simply be wrong.
2. In cases like Hooke's law, the rule is more important than the exceptions for downstream courses. I would only present an experimental exception after the rule has been verified. There is probably time for cases that include both the rule and exceptions to Hooke's law in a 3 hour college lab once students are reasonably skilled and efficient. But this is unlikely in most 1 hour high school physics and physical science classes.
3. If a hypothesis will not be supported, I like students to have built enough analysis skills to suggest a different hypothesis. At some point in a lab course, students will be familiar with the most common functional forms: linear, quadratic, power law, square root, etc. and will have tested various data sets against multiple possibilities. If one hypothesis is not supported (such as a linear relationship), it is nice if students can explore other possibilities and suggest an alternative hypothesis from their data.
May I quote you on that and give it to my current students?
:biggrin:
Zz.Certainly, but your students might not appreciate it. We get old too soon and smart too late, probably applies.
Zz, too bad I'm so old. It sounds like it would be fun to be one of your students.May I quote you on that and give it to my current students?
:biggrin:
Zz.
Zz, too bad I'm so old. It sounds like it would be fun to be one of your students.
I guess I was fortunate enough that most of the science labs were enjoyable to participate in. I do remember that sometimes we did not get the desired result. That was frustrating.
I like how you designed the experiment for the students to learn about the concept as well as the scientific method.You may not believe it, but part of my Hooke's law experiment that I gave to my students were DESIGNED to not work "as expected". I gave them springs that had been abused and no longer exhibit the linear behavior, but I never told them that. Looking at the F versus x graph will show that this wonky spring did not show the same behavior as the Hooke's law spring.
You'd be surprised how many students IGNORED this, and blindly fit a straight line to something that clearly could not be accurately represented by a straight line.
Part of doing an experiment is the ability to handle things when something unexpected happens. You cannot be oblivious to what the data are telling you and simply forced it into ways that you expect them to be, or if there was something weird going on that may be attributed to error in the measurement or setup. I repeatedly have told to my students that they can get away with getting unexpected result and still get very good grade for the lab report, IF they are able to account for the strange result and were cognizant to the fact that something unexpected was obtained.
Zz.
Wow ZapperZ, that’s a nice experiment to do…
I guess I was fortunate enough that most of the science labs were enjoyable to participate in. I do remember that sometimes we did not get the desired result. That was frustrating.
I like how you designed the experiment for the students to learn about the concept as well as the scientific method.
That is a thoroughly enjoyable article. Thank you @Dr. Courtney.
I never did well in laboratory lessons in school, and I thought they were boring. Perhaps if I had a teacher who so clearly explained what we were doing and why, as you did in the article, that outcome may have been different.I have to confess, for my first 5 years as a teacher, I used canned laboratory exercises that had been written by others that had many of the flaws you mention. Student engagement was low due to the lack of excitement and interest, so the care they exercised and the learning they accomplished also tended to be low. I also viewed the point of the lab as reinforcing material from the lecture.
Eventually, I shifted in my view so that the main focus of labs became understanding and applying the scientific method itself. This naturally caused me to desire greater accuracy, since an experiment with 1% errors tests any hypothesis more rigorously than the experiments with 5-10% errors that I had been doing. I think the biggest part in motivating accuracy is showing it can be achieved with due care at a few important points along the way. But one also needs to avoid labs and equipment where the learning curve is just too steep for most students to have accurate results. Consequently, one needs to be content not having a lab that corresponds with every chapter in the book.
These days, I write my own labs and before being overly confident in student ability to achieve results, I pilot the experiments myself and also check out the lab equipment carefully. It is extremely demotivating for students to be expected to have accurate results using faulty equipment in the compressed time frame of most lab experiments.
Love how this Insight is laid out and especially the top “Learning Objectives” bit!
That is a thoroughly enjoyable article. Thank you @Dr. Courtney.
I never did well in laboratory lessons in school, and I thought they were boring. Perhaps if I had a teacher who so clearly explained what we were doing and why, as you did in the article, that outcome may have been different.