Checking Graphs: Are the Results Accurate?

  • Thread starter Differentiate it
  • Start date
  • Tags
    Graphs
In summary: There is not a discontinuity on the graph for ##m_1##. So, it is not clear how much mass is being accelerated.
  • #1
Differentiate it
63
2
Homework Statement
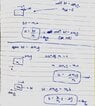
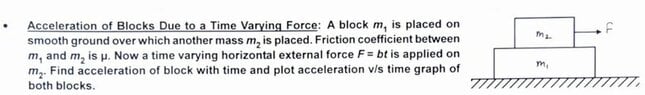
Acceleration of Blocks Due to a Time Varying Force: A block m, is placed on smooth ground over which another mass m, is placed. Friction coefficient between m, and m₂ is u. Now a time varying horizontal external force F = bt is applied on m2. Find acceleration of block with time and plot acceleration v/s time graph of both blocks.
Relevant Equations
F = ma
graph.jpg

I have attempted this question - Are the graphs correct?
 

Attachments

  • Screenshot_20221013-224546~2.jpg
    Screenshot_20221013-224546~2.jpg
    17.3 KB · Views: 53
Last edited:
Physics news on Phys.org
  • #2
Is ##m_2## sitting on top of ##m_1##? It isn't clear in the problem statement.
 
  • Like
Likes berkeman
  • #3
erobz said:
Is ##m_2## sitting on top of ##m_1##? It isn't clear in the problem statement.
Yes, it is. Sorry for not mentioning it earlier
 

Attachments

  • Screenshot_20221013-224546~2.jpg
    Screenshot_20221013-224546~2.jpg
    17.5 KB · Views: 52
  • #4
What causes the discontinuity?
 
  • #5
1) What is the reasoning that you expect a drop in acceleration for ##m_2## once the force ##F## exceeds the static friction between the masses (think about the change in force acting on each of the masses from static to kinetic friction)?

2) The slope of the acceleration vs time before and after the discontinuity appear parallel to me, is that drawn to scale (they won't be parallel)?

3) For the same reason in (1), how does that effect the graph for ##m_1## (there is a missing discontinuity there)?
 
Last edited:
  • Like
Likes hutchphd
  • #6
erobz said:
1) What is the reasoning that you expect a drop in acceleration for ##m_2## once the force ##F## exceeds the static friction between the masses?

2) The slope of the acceleration vs time before and after the discontinuity appear parallel to me, is that drawn to scale?
Yes, it is supposed to be parallel Here is my working if you want to take a look
 

Attachments

  • wor.jpg
    wor.jpg
    47.6 KB · Views: 55
  • #7
erobz said:
1) What is the reasoning that you expect a drop in acceleration for ##m_2## once the force ##F## exceeds the static friction between the masses?

2) The slope of the acceleration vs time before and after the discontinuity appear parallel to me, is that drawn to scale?
 

Attachments

  • wor.jpg
    wor.jpg
    47.6 KB · Views: 52
  • #8
So, you think the slope of ##a_2(t)## before and after ##t = \frac{\mu m_2g}{b}## are equal. Hmmm.

Before the force of static friction is exceeded what is the acceleration ##a_2(t)## of ##m_2##? What is the acceleration ##a_1(t)## of ##m_1##?
 
  • #9
erobz said:
So, you think the slope of ##a_2(t)## before and after ##t = \frac{\mu m_2g}{b}## are equal. Hmmm.

Before the force of static friction is exceeded what is the acceleration ##a_2(t)## of ##m_2##? What is the acceleration ##a_1(t)## of ##m_1##?
Both are the same: bt/m1
 
  • #10
Differentiate it said:
Both are the same:
The first part is correct. They are both the same.
Differentiate it said:
bt/m1
The second part is not.
 
  • Like
Likes hutchphd
  • #11
erobz said:
The first part is correct. They are both the same.

The second part is not.
Could you please explain why?
 
  • #12
Differentiate it said:
Could you please explain why?
How much mass is being accelerated by the applied force ##F## on ##m_2##?

Remember, we are talking about a time before they (##m_1## & ##m_2##) "unstick" at this point.
 
Last edited:
  • Like
Likes hutchphd

1. How do I know if the results shown on the graph are accurate?

To determine the accuracy of the results shown on a graph, you can compare it with the data or information used to create the graph. If the graph is based on accurate and reliable data, then the results shown should also be accurate.

2. What are some common errors that can affect the accuracy of a graph?

Some common errors that can affect the accuracy of a graph include incorrect data entry, incorrect labeling of axes, and using the wrong type of graph for the data being presented. It is important to double check all data and labels before creating a graph to ensure accuracy.

3. Can a graph be accurate even if it does not show a clear trend or pattern?

Yes, a graph can still be accurate even if it does not show a clear trend or pattern. This may occur when the data being presented is random or does not follow a specific pattern. In this case, it is important to accurately represent the data on the graph, even if there is no clear trend.

4. How can I check the accuracy of a graph if I do not have access to the original data?

If you do not have access to the original data used to create a graph, you can check the accuracy by comparing it with other sources or by conducting a similar experiment to see if you get similar results. It is also helpful to consult with other experts in the field to verify the accuracy of the graph.

5. Are there any tools or methods that can help me check the accuracy of a graph?

Yes, there are several tools and methods that can help you check the accuracy of a graph. These include statistical analysis, data validation software, and peer review. It is important to use multiple methods to ensure the accuracy of a graph and its results.

Similar threads

  • Introductory Physics Homework Help
Replies
2
Views
93
  • Introductory Physics Homework Help
Replies
10
Views
715
  • Introductory Physics Homework Help
Replies
5
Views
775
  • Introductory Physics Homework Help
Replies
6
Views
499
  • Introductory Physics Homework Help
Replies
5
Views
270
  • Introductory Physics Homework Help
Replies
16
Views
2K
  • Introductory Physics Homework Help
Replies
5
Views
1K
  • Introductory Physics Homework Help
Replies
25
Views
1K
  • Introductory Physics Homework Help
Replies
1
Views
931
  • Introductory Physics Homework Help
Replies
12
Views
615
Back
Top