4.02 Normal Properties: WATER
The word normal means "having the pressure, one atmosphere." The brief sketch (a pressure-temperature projection of the surface of water) is called a "phase diagram." Phase change temperatures and regions of solid, liquid and gas and shown.
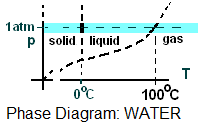 The horizontal dashed line (pressure = 1 atm) is the locus "normal" states of water. One format for normal properties is a list of phase change temperatures, average specific heats for each phase and latent heats for phase changes - Figure 1 and Table 1.
| Figure 1: p-T Perspective - Normal States: WATER (@ 1 Atm) |
- Figure 1 is a perspective (not to scale) of the p-v-T surface for water. Locations along the dashed line indicate "normal states." Solid, liquid and gas regions, notated "(A), (C), and (E)" in Figure 1, have their single phase properties listed in Table 1 columns, "(A), (C), and (E)," respectively.
- Table 1: Row 1 presents the common names of "heat event" for single phase (A, C or E) and phase change (B or D). Relevant properties are in rows 2,3, and 4.
- Table cell (4A) and (4C) list (4)
Energy Equation: At its basis, the energy equation recognizes energy of a system and equates its potential changes to the energy change mechanisms, work and heat. We find energy equations written in three mathematical forms: Differential, Increment, and Rate.