ribella
- 6
- 0
- TL;DR
- Plot of the photocurrent versus the wavelength of light of a GaAs/InGaAs/Si top-illuminated pin photodetector
Greetings,
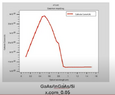
I am trying to obtain a plot of the photocurrent versus the wavelength of light of a GaAs/InGaAs/Si top-illuminated pin photodetector, where the doping ratio for p-type GaAs is conc=1e17, for i-layer In_xGa_1-xAs conc=1e14 and for n-type Si conc=1e18. Firstly, for x=0.05, if we illuminate this structure with top light, the plot of the photocurrent versus the wavelength of light we obtain is as follows:

For x=0.1:

For x=0.2:

Finally, for x=0.3:

What I don't fully understand here is that the In_xGa_1-xAs layer is the active layer here and Eg=1.351 eV for x=0.05, so I would expect a peak of around 0.918 micrometres in the wavelength plot of the current coming out of the pin detector. The same situation is Eg=1.279 eV for x=0.1 and the corresponding cut-off wavelength is a peak at 0.970 micrometres. Moreover, for x=0.2 and 0.3 the peak disappears as you can see in the graphs. What could be the physical explanation for these phenomena?
I am trying to obtain a plot of the photocurrent versus the wavelength of light of a GaAs/InGaAs/Si top-illuminated pin photodetector, where the doping ratio for p-type GaAs is conc=1e17, for i-layer In_xGa_1-xAs conc=1e14 and for n-type Si conc=1e18. Firstly, for x=0.05, if we illuminate this structure with top light, the plot of the photocurrent versus the wavelength of light we obtain is as follows:
For x=0.1:
For x=0.2:
Finally, for x=0.3:
What I don't fully understand here is that the In_xGa_1-xAs layer is the active layer here and Eg=1.351 eV for x=0.05, so I would expect a peak of around 0.918 micrometres in the wavelength plot of the current coming out of the pin detector. The same situation is Eg=1.279 eV for x=0.1 and the corresponding cut-off wavelength is a peak at 0.970 micrometres. Moreover, for x=0.2 and 0.3 the peak disappears as you can see in the graphs. What could be the physical explanation for these phenomena?
Attachments