Bypass
- 2
- 0
I am trying to understand how to draw nyquist plot.
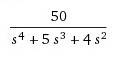
Lets say the transfer function is
Subbing in jω for s,
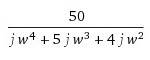 ***Note: should be (jw)^4 , (jw)^3, (jw)^2
Then separating the Real and Imaginary part,
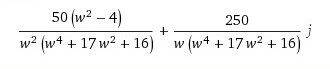
So when
w = 0, in the nyquist plot it is infinity
w = infinity, it is 0
Imaginary intercept is 1.25
For real intercept I am not sure. Since imaginary part is 0 only when w is infinity, i plug in infinity for w in real part. Would the real intercept be infinity or 0? It would be infinity/infinity but numerator is lower order than higher order so would it be 0 instead?
In any case, how am i supposed to plot the rough nyquist plot or at least be able to determine the stability using these 4 points?
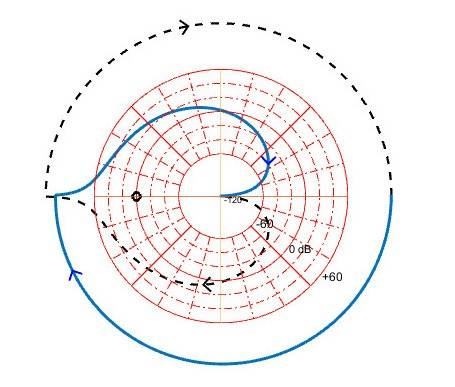
In Matlab the Nyquist plot comes out like this
Lets say the transfer function is
Subbing in jω for s,
Then separating the Real and Imaginary part,
So when
w = 0, in the nyquist plot it is infinity
w = infinity, it is 0
Imaginary intercept is 1.25
For real intercept I am not sure. Since imaginary part is 0 only when w is infinity, i plug in infinity for w in real part. Would the real intercept be infinity or 0? It would be infinity/infinity but numerator is lower order than higher order so would it be 0 instead?
In any case, how am i supposed to plot the rough nyquist plot or at least be able to determine the stability using these 4 points?
In Matlab the Nyquist plot comes out like this
Attachments

Last edited: