Discussion Overview
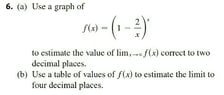
The discussion revolves around finding the limit of a power function using the Desmos graphing calculator. Participants explore the implications of graphing behavior at different values of x, particularly focusing on limits as x approaches infinity and the relevance of specific limit forms.
Discussion Character
- Exploratory
- Debate/contested
- Mathematical reasoning
Main Points Raised
- Some participants express uncertainty about how to take limits and the appropriate values of x to consider, questioning the use of large negative values versus large positive values.
- One participant suggests using the standard limit form involving e, indicating it could be helpful in solving the problem.
- There is a contention regarding the graph's behavior on the positive side, with some participants asserting that there is no graph while others disagree.
- Participants discuss the conditions under which the graph of the function appears or disappears, particularly in the range of 0 to 2, raising questions about division by zero and taking even roots of negative numbers.
- One participant emphasizes that the graph's behavior between 0 and 2 is not critical for the limit analysis, suggesting that examining the graph at large x values is more relevant.
Areas of Agreement / Disagreement
Participants do not reach a consensus on the graph's behavior in certain ranges or the correct approach to take for finding the limit. Multiple competing views remain regarding the significance of the graph's appearance and the appropriate limit evaluation strategy.
Contextual Notes
Limitations include unresolved questions about the function's behavior in specific intervals, the implications of division by zero, and the conditions under which the graph is defined.