Momentum density of silicon valence band using bandstructure

  • Context: Graduate 
  • Thread starter Thread starter Samisdabes
  • Start date Start date
  • Tags Tags
    Silicon Valence band
Join the discussion
Ask a follow-up here, or get your own question answered by working scientists, mathematicians and engineers — people, not an autocomplete.
Real named experts · corrections over time · the nuance an AI answer skips
2 replies · 5K views
Samisdabes
Messages
1
Reaction score
0
TL;DR
I am attempting to use python to calculate the gradient of the bandstructure for the 3 bands in the valence band for a bandstructure, at a discrete set of points and then plot them in a histogram to get the electron momentum density curve. However I have problems.
I have included the resulting histogram that emerges when I do this procedure and it does not look as expected. I am using CASTEP and have read the .bands file as a txt file into python where i have extracted the relevant data.
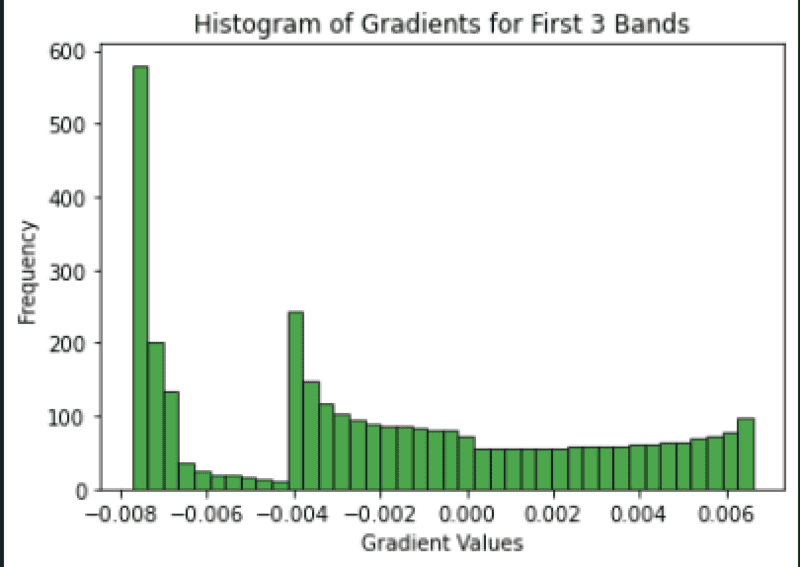
Screenshot 2023-12-13 at 20.16.28.png
 
Physics news on Phys.org
You don't give us enough information to interpret your plot. However, if you want the band-gradients in momentum space then they are basically the optical matrix elements, so just ask CASTEP for them:

task : spectral
spectral_task : optics

and then make sure your spectral_kpoints_list has the k-points you want.
 
Reply
  • Like
Likes   Reactions: Spinnor