fog37
- 1,566
- 108
- TL;DR
- Checking for normality of errors and residuals in ordinary linear regression
Hello,
In reviewing the classical linear regression assumptions, one of the assumptions is that the residuals have a normal distribution...I also read that this assumption is not very critical and the residual don't really have to be Gaussian.
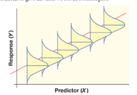
That said, the figure below show ##Y## values and their residuals with a normal distribution of equal variance at the ##X## value:

To check for residual normality, should we check the distribution of residuals at each ##X## (not very practical)? Instead, we usually plot a histogram of ALL the residuals at different X values...But that is not what the assumption is about (normality of residuals for each predictor ##X## value)...
Thank you...
In reviewing the classical linear regression assumptions, one of the assumptions is that the residuals have a normal distribution...I also read that this assumption is not very critical and the residual don't really have to be Gaussian.
That said, the figure below show ##Y## values and their residuals with a normal distribution of equal variance at the ##X## value:
To check for residual normality, should we check the distribution of residuals at each ##X## (not very practical)? Instead, we usually plot a histogram of ALL the residuals at different X values...But that is not what the assumption is about (normality of residuals for each predictor ##X## value)...
Thank you...