Polynomials in Matlab - Plotting Results

  • Context: MATLAB 
  • Thread starter Thread starter ineedhelpnow
  • Start date Start date
  • Tags Tags
    Matlab Polynomials
Join the discussion
Ask a follow-up here, or get your own question answered by working scientists, mathematicians and engineers — people, not an autocomplete.
Real named experts · corrections over time · the nuance an AI answer skips
2 replies · 2K views
ineedhelpnow
Messages
649
Reaction score
0
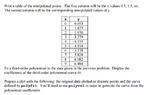
View attachment 5037

Code:
y = [0.053 1.477 1.970 3.279 4.153 4.934 5.178 5.828 6.082 6.484]; % data
coef = polyfit(x,y,3) 
X=0:.1:9;
Y=polyval(coef,X);
plot(x,y,'o',X,Y)

that's my code. did i do it right?
 

Attachments
  • 1.png
    1.png
    16.9 KB · Views: 142
Physics news on Phys.org
You need to define your $x$ values. This should be right:

Code:
y = [0.053 1.477 1.970 3.279 4.153 4.934 5.178 5.828 6.082 6.484]; % data
x = [0 1 2 3 4 5 6 7 8 9];
coef = polyfit(x,y,3) 
X=0:.1:9;
Y=polyval(coef,X);
plot(x,y,'o',X,Y)

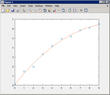
Output:

View attachment 5038

You can add a title, legend, and axis labels if you want, using [m]title()[/m], [m]legend()[/m], [m]xlabel()[/m], [m]ylabel()[/m], respectively.
 

Attachments

  • interpolation.PNG
    interpolation.PNG
    5.2 KB · Views: 136
i cut that part of the code out by mistake but i have it in there. i see it's the same graph though. thanks rido!