Dustinsfl
- 2,217
- 5
\begin{alignat*}{3}
u_{tt} & = & c^2u_{xx}\\
u(0,t) & = & 0\\
u_x(L,t) & = & 0\\
u(x,0) & = & \frac{x}{L}\\
u_t(x,0) & = & 0
\end{alignat*}
Let's start with $u_t(x,0) = 0$. Then
$$
u_t(x,0) = \sum_{n = 1}^{\infty}B_n\frac{\pi c}{L}\left(n + \frac{1}{2}\right)\sin\left[\frac{\pi x}{L}\left(n + \frac{1}{2}\right)\right] = 0.
$$
That is, $B_n = 0$. Using the first initial condition, we have
$$
u(x,0) = \sum_{n = 1}^{\infty}A_n\sin\left[\frac{\pi x}{L}\left(n + \frac{1}{2}\right)\right] = \frac{x}{L}.
$$
Now we can solve for the Fourier coefficient $A_n$.
\begin{alignat*}{3}
A_n & = & \frac{2}{L^2}\int_0^{\pi}x\sin\left[\frac{\pi x}{L}\left(n + \frac{1}{2}\right)\right]dx\\
& = & \left.\frac{-4(2n + 1)x\pi\cos\left[\left(n + \frac{1}{2}\right)\frac{\pi x}{L}\right] + 8L\sin\left[\left(n + \frac{1}{2}\right)\frac{\pi x}{L}\right]}{L\pi^2(2n + 1)^2}\right|_0^{\pi}\\
& = & \frac{8\cos n\pi + 4(2n + 1)\pi\sin n\pi}{\pi^2(2n + 1)^2}\\
& = & \frac{8(-1)^n}{\pi^2(2n + 1)^2}
\end{alignat*}
So the solution is
$$
u(x,t) = \frac{8}{\pi^2}\sum_{n = 1}^{\infty}\frac{(-1)^n}{(2n + 1)^2}\sin\left[\frac{\pi x}{L}\left(n + \frac{1}{2}\right)\right]\cos\left[\frac{\pi ct}{L}\left(n + \frac{1}{2}\right)\right].
$$
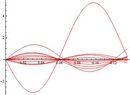
When $L = \pi$ and $c = 1$, we have $u(x,t) = \frac{8}{\pi^2}\sum\limits_{n = 1}^{\infty}\frac{(-1)^n}{(2n + 1)^2}\sin\left[x\left(n + \frac{1}{2}\right)\right]\cos\left[t\left(n + \frac{1}{2}\right)\right]$.
Plot the bar displacement distribution at 10 equally-spaced times during one period of oscillation. What is this asking me to do?
u_{tt} & = & c^2u_{xx}\\
u(0,t) & = & 0\\
u_x(L,t) & = & 0\\
u(x,0) & = & \frac{x}{L}\\
u_t(x,0) & = & 0
\end{alignat*}
Let's start with $u_t(x,0) = 0$. Then
$$
u_t(x,0) = \sum_{n = 1}^{\infty}B_n\frac{\pi c}{L}\left(n + \frac{1}{2}\right)\sin\left[\frac{\pi x}{L}\left(n + \frac{1}{2}\right)\right] = 0.
$$
That is, $B_n = 0$. Using the first initial condition, we have
$$
u(x,0) = \sum_{n = 1}^{\infty}A_n\sin\left[\frac{\pi x}{L}\left(n + \frac{1}{2}\right)\right] = \frac{x}{L}.
$$
Now we can solve for the Fourier coefficient $A_n$.
\begin{alignat*}{3}
A_n & = & \frac{2}{L^2}\int_0^{\pi}x\sin\left[\frac{\pi x}{L}\left(n + \frac{1}{2}\right)\right]dx\\
& = & \left.\frac{-4(2n + 1)x\pi\cos\left[\left(n + \frac{1}{2}\right)\frac{\pi x}{L}\right] + 8L\sin\left[\left(n + \frac{1}{2}\right)\frac{\pi x}{L}\right]}{L\pi^2(2n + 1)^2}\right|_0^{\pi}\\
& = & \frac{8\cos n\pi + 4(2n + 1)\pi\sin n\pi}{\pi^2(2n + 1)^2}\\
& = & \frac{8(-1)^n}{\pi^2(2n + 1)^2}
\end{alignat*}
So the solution is
$$
u(x,t) = \frac{8}{\pi^2}\sum_{n = 1}^{\infty}\frac{(-1)^n}{(2n + 1)^2}\sin\left[\frac{\pi x}{L}\left(n + \frac{1}{2}\right)\right]\cos\left[\frac{\pi ct}{L}\left(n + \frac{1}{2}\right)\right].
$$
When $L = \pi$ and $c = 1$, we have $u(x,t) = \frac{8}{\pi^2}\sum\limits_{n = 1}^{\infty}\frac{(-1)^n}{(2n + 1)^2}\sin\left[x\left(n + \frac{1}{2}\right)\right]\cos\left[t\left(n + \frac{1}{2}\right)\right]$.
Plot the bar displacement distribution at 10 equally-spaced times during one period of oscillation. What is this asking me to do?