1man
- 16
- 0
For the motion diagram given , sketch the shape of the corresponding motion graphs in Parts A to D. Use the indicated coordinate system. One unit of time elapses between consecutive dots in the motion diagram.
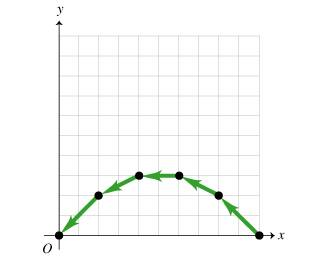
I've already constructed an x vs t and y vs t graph please help me with these because i don't know how to do these.
Construct a possible graph for the x velocity versus time, v_x(t).
Construct a possible graph for the y velocity versus time, v_y(t).
I've already constructed an x vs t and y vs t graph please help me with these because i don't know how to do these.
Construct a possible graph for the x velocity versus time, v_x(t).
Construct a possible graph for the y velocity versus time, v_y(t).