De1.2.1 Solve the following initial value problem

Click For Summary

Discussion Overview

The discussion revolves around solving an initial value problem involving a first-order differential equation. Participants explore the solution method, graphing techniques, and the implications of varying initial conditions.

Discussion Character

  • Technical explanation
  • Mathematical reasoning
  • Exploratory

Main Points Raised

  • One participant presents the differential equation and attempts to derive the solution, expressing uncertainty about their process.
  • Another participant clarifies a step in the derivation, confirming the relationship between the constants and the initial condition.
  • There is discussion on how to visualize the solutions using Desmos, with suggestions for using sliders to represent different initial conditions.
  • Some participants express confusion about how to represent multiple graphs and the role of the parameter \(y_0\) in the context of the solutions.
  • Questions arise regarding the interpretation of time in the context of the model, particularly concerning negative time and its implications for the initial observation.
  • A later reply suggests that negative time can be considered, depending on the modeling context, indicating a potential for exploring past states of the system.

Areas of Agreement / Disagreement

Participants generally agree on the method of solving the differential equation and the use of graphical representations. However, there is uncertainty regarding the interpretation of time and the implications of negative time, indicating that this aspect remains unresolved.

Contextual Notes

Limitations include potential misunderstandings about the role of initial conditions and the representation of time in the model, which may affect the interpretation of the solutions.

karush
Gold Member
MHB
Messages
3,240
Reaction score
5
$\tiny{de1.2.1}$
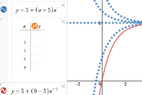
$\textsf{ Solve each of the following initial value problems and plot the solutions for several values of $y_0$.}\\$
$\textsf{ Then describe in a few words how the solutions resemble, and differ from, each other.}\\$
$$\begin{align*}\displaystyle
\frac{dy}{dt}&=-y+5, \quad y(0)=y_0\\
y'&=-y+5\\
y'+y&=5\\
u(t)&=\exp\int \, dt = e^t\\
e^ty'+e^ty&=e^t5\\
(e^ty)'&=e^t5\\
e^ty &=5\int e^t dt=5e^t+c\\
y &=5+\frac{c}{e^t}\\
y(0)&=5+c
\end{align*}$$
$\textit{ok not sure where I went off the rails but the book answer is}\\$ $$y=5+(y_0-5)e^{-t}$$
$\textit{also not sure how this would be set up in Desmos}$
 
Physics news on Phys.org
You correctly stated:

$$y(0)=5+c$$

You just need to add:

$$y(0)=5+c=y_0\implies c=y_0-5$$

And so your solution is:

$$y(y)=5+\left(y_0-5\right)e^{-t}$$

I would use a Desmos slider:

[DESMOS]advanced: {"version":5,"graph":{"squareAxes":false,"viewport":{"xmin":-10,"ymin":-10,"xmax":10,"ymax":10}},"expressions":{"list":[{"type":"expression","id":"graph1","color":"#2d70b3","latex":"y=5+\\left(a-5\\right)e^{-x}","style":"SOLID"},{"type":"expression","id":"2","color":"#388c46","latex":"a=0","hidden":true,"style":"SOLID"}]}}[/DESMOS]

Now, manually move or animate the slider to see how the solution behaves for differing values of the parameter.
 
thank you
I got ? on $y_0$ thing

so multiple graphs would just be $y(1) \quad y(2) \cdots$ for $y(a)$ ?
 
karush said:
thank you
I got ? on $y_0$ thing

so multiple graphs would just be $y(1) \quad y(2) \cdots$ for $y(a)$ ?

I'm not sure I know what you mean. If you want multiple graphs, you could just define them like this:

[DESMOS]advanced: {"version":5,"graph":{"squareAxes":false,"viewport":{"xmin":-10,"ymin":-10,"xmax":10,"ymax":10}},"expressions":{"list":[{"type":"expression","id":"graph1","color":"#2d70b3","latex":"y=5+\\left(-10-5\\right)e^{-x}","style":"SOLID"},{"type":"expression","id":"2","color":"#388c46","latex":"y=5+\\left(-5-5\\right)e^{-x}","style":"SOLID"},{"type":"expression","id":"3","color":"#fa7e19","latex":"y=5+\\left(0-5\\right)e^{-x}","style":"SOLID"},{"type":"expression","id":"4","color":"#6042a6","latex":"y=5+\\left(5-5\\right)e^{-x}","style":"SOLID"},{"type":"expression","id":"5","color":"#000000","latex":"y=5+\\left(10-5\\right)e^{-x}","style":"SOLID"},{"type":"expression","id":"6","color":"#c74440","latex":"y=5+\\left(15-5\\right)e^{-x}","style":"SOLID"}]}}[/DESMOS]
 

Attachments

  • de2..2.1mhb.png
    de2..2.1mhb.png
    8 KB · Views: 148
[DESMOS]advanced: {"version":5,"graph":{"xAxisLabel":"t","yAxisLabel":"y","squareAxes":false,"viewport":{"xmin":-10.72837090838311,"ymin":-10.471822929382325,"xmax":10.52162909161689,"ymax":10.778177070617675}},"expressions":{"list":[{"type":"expression","id":"graph1","color":"#2d70b3","latex":"y=5+\\left(0-5\\right)e^{-t}","style":"SOLID"},{"type":"expression","id":"2","color":"#388c46","latex":"y=5+\\left(10-5\\right)e^{-t}","style":"SOLID"},{"type":"expression","id":"3","color":"#fa7e19","latex":"y=5","style":"SOLID"},{"type":"expression","id":"4","color":"#6042a6","latex":"y=5+\\left(-5-5\\right)e^{-t}","style":"SOLID"},{"type":"expression","id":"5","color":"#000000","latex":"y=5+\\left(15-5\\right)e^{-t}","style":"SOLID"}]}}[/DESMOS]

You can use \(t\) as the independent variable, and even label the axis, as you see above.
 
Ok.

But is there negative time
Or past time
 
karush said:
Ok.

But is there negative time
Or past time

Sure, we can consider time before time \(t=0\), depending on what we're modeling. We can say that time \(t=0\) corresponds to out initial observation of the system, where negative values of \(t\) correspond to times before our observation and positive values of \(t\) correspond to times after the initial observation.
 

Similar threads

Replies
2
Views
2K
  • · Replies 6 ·
Replies
6
Views
2K
  • · Replies 5 ·
Replies
5
Views
2K
  • · Replies 1 ·
Replies
1
Views
2K
  • · Replies 7 ·
Replies
7
Views
3K
  • · Replies 5 ·
Replies
5
Views
2K
Replies
5
Views
2K
  • · Replies 9 ·
Replies
9
Views
5K
  • · Replies 7 ·
Replies
7
Views
4K
  • · Replies 3 ·
Replies
3
Views
1K