Drawing trig graphs with exact radian values in software

  • Context:
  • Thread starter Thread starter Casio1
  • Start date Start date
  • Tags Tags
    Graphs Symmetry
Join the discussion
Registration is free. Ask a follow-up in this thread, or start your own.
3 replies · 4K views
Casio1
Messages
86
Reaction score
0
Hi,

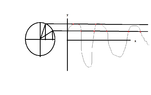
I have included a sketch drawing of a graph that I am not entiry sure is correct for what I am trying to do?

I have found the exact values of Sin, Cos and Tan of some given values in radians, and am asked to use the symmetry of graphs of sin, cos and tan to find the exact values of some more given data in radians.

I don't want the work to be done for me, but would appreciate some help how to either draw the graphs or recommend a piece of software that will draw the graphs, but allow me to enter the data in radians (exact form) for presentation.

Kind regards

Casio
 

Attachments
  • Sin x.png
    Sin x.png
    3.6 KB · Views: 149
Physics news on Phys.org
You can graph the trig functions in ms-excel to be used for presentation.

When finding addtional solutions add/subtract the period to your initial solutions
 
Casio said:
Hi,

I have included a sketch drawing of a graph that I am not entiry sure is correct for what I am trying to do?

I have found the exact values of Sin, Cos and Tan of some given values in radians, and am asked to use the symmetry of graphs of sin, cos and tan to find the exact values of some more given data in radians.

I don't want the work to be done for me, but would appreciate some help how to either draw the graphs or recommend a piece of software that will draw the graphs, but allow me to enter the data in radians (exact form) for presentation.

Kind regards

Casio

Hi Casio, :)

One online graphing tool that you can use is the >>Desmos Graphing Calculator<<. What particular set of points do you want to mark on the graph?

Kind Regards,
Sudharaka.
 
Thanks for the replies I have marked thanks for all.

The software requires me to update to windows 9 however if I do that as I did once before, the bugs they had not sorted out caused me problems on my computer, so I am unsure about that now?

I must admit though I did not think about Excell to do it as the templates on there seem limited and I have not seen anything on that program to create circles in conjunction with sine waves, so if that is possible with excell it will be a fast learning curve for me;)What I want to do if my diagram is anything like what it should be is to plot some points on the graph and instead of writing degrees on the graph, I would like to use radians, i.e. pi/3 on the graph.

kind regards

Casio (Smile)