WWCY
- 476
- 15
Hi all, I am having trouble understanding the some ideas presented in some notes I've been reading, help is greatly appreciated!
I've uploaded screenshots of the material I'm referring to below, the last two images are what I'm mainly referencing, and the first few are to provide context (sufficiently I hope). Question 1: last image (empty-lattice approx)
By taking the potential terms to be 0, the energy was shown to be
$$E = \frac{\hbar^2 (\vec{q} - \vec{G'})}{2m}$$
Where ##\vec{q}## is some vector in the first Brillouin Zone and ##\vec{G'}## is a reciprocal translation vector that maps wavevector ##\vec{k}## back to ##\vec{q}##. The dispersion was then plotted out. However, how does one infer the periodicity of the dispersion from this energy equation? All I can tell is that ##q \in [- \pi / a , \pi/a)## and ##G## simply translates every ##k## outside of 1BZ back to some q, but all i can sketch out (E vs K) is a big parabola stretching to infinity as K gets larger. What should my thinking process be when making the sketch?
Question 2: last image (empty-lattice approx)
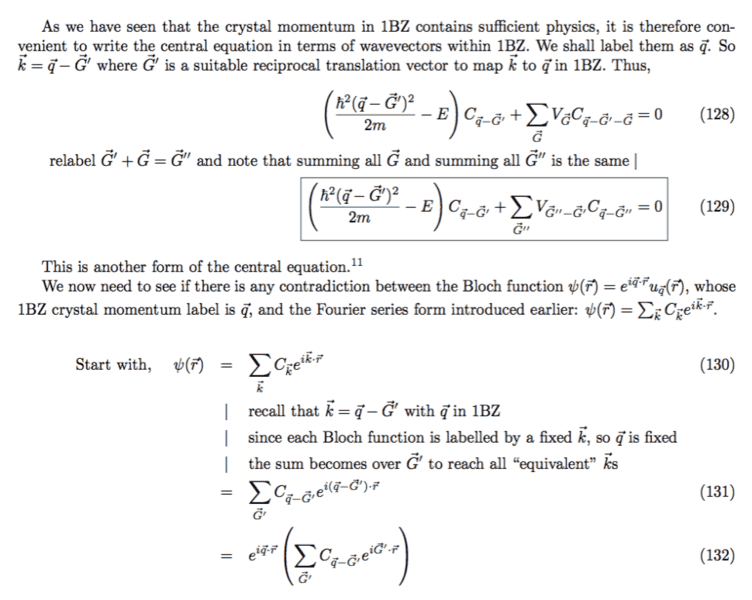
It was mentioned here on the figure that there were degenerate energy levels. However I can't see where this degeneracy comes from. In equation (136), all we have done is find out that the solution to the central equation (first image (131)),
$$ \psi( \vec{r} , \vec{q} ) = \sum_{ \vec{G'} } C_{ \vec{q}- \vec{G'} } e^{i ( \vec{q} - \vec{G'} ) \cdot \vec{r} } $$
has the energy dispersion given above. How does this imply any kind of degeneracy?
Many thanks in advance!
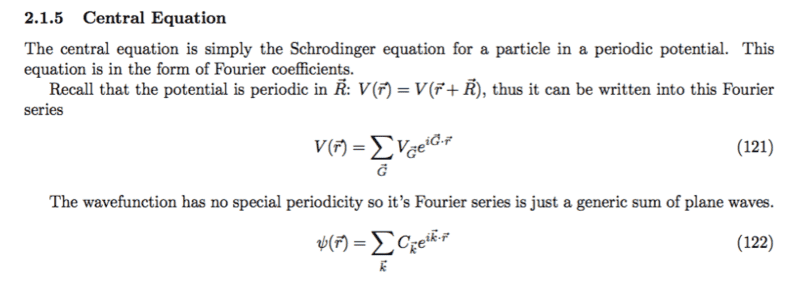
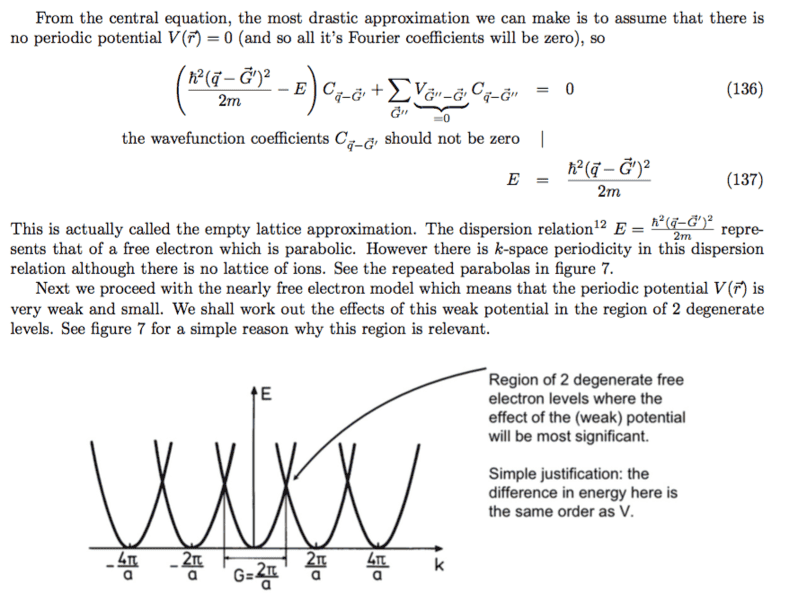
I've uploaded screenshots of the material I'm referring to below, the last two images are what I'm mainly referencing, and the first few are to provide context (sufficiently I hope). Question 1: last image (empty-lattice approx)
By taking the potential terms to be 0, the energy was shown to be
$$E = \frac{\hbar^2 (\vec{q} - \vec{G'})}{2m}$$
Where ##\vec{q}## is some vector in the first Brillouin Zone and ##\vec{G'}## is a reciprocal translation vector that maps wavevector ##\vec{k}## back to ##\vec{q}##. The dispersion was then plotted out. However, how does one infer the periodicity of the dispersion from this energy equation? All I can tell is that ##q \in [- \pi / a , \pi/a)## and ##G## simply translates every ##k## outside of 1BZ back to some q, but all i can sketch out (E vs K) is a big parabola stretching to infinity as K gets larger. What should my thinking process be when making the sketch?
Question 2: last image (empty-lattice approx)
It was mentioned here on the figure that there were degenerate energy levels. However I can't see where this degeneracy comes from. In equation (136), all we have done is find out that the solution to the central equation (first image (131)),
$$ \psi( \vec{r} , \vec{q} ) = \sum_{ \vec{G'} } C_{ \vec{q}- \vec{G'} } e^{i ( \vec{q} - \vec{G'} ) \cdot \vec{r} } $$
has the energy dispersion given above. How does this imply any kind of degeneracy?
Many thanks in advance!
Attachments


