Bensky
- 82
- 0
[SOLVED] Need help with a force vs time graph. :(
Which interval in Fig. MC3 corresponds to the greatest change in the speed of the body?
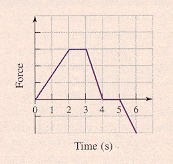
Figure MC3 is above.
a) 1-2s
b) 0-1s
c) 2-3s
None
I figured out that 1-2s has the greatest slope of the three, would that indicate that it has the greatest change in speed? It seems logical to me but I don't really understand this graph, so I don't want to guess and get the wrong answer (this is my last try to get it right). It seems like it would be really simple.
Homework Statement
Which interval in Fig. MC3 corresponds to the greatest change in the speed of the body?
Figure MC3 is above.
a) 1-2s
b) 0-1s
c) 2-3s
Homework Equations
None
The Attempt at a Solution
I figured out that 1-2s has the greatest slope of the three, would that indicate that it has the greatest change in speed? It seems logical to me but I don't really understand this graph, so I don't want to guess and get the wrong answer (this is my last try to get it right). It seems like it would be really simple.
Attachments
