marco02
- 1
- 1
Thread moved from the technical forums to the schoolwork forums
- Homework Statement
- ddòd
- Relevant Equations
- lsd
Good morning, I have an exercise with two points that gives a Matlab mat file in which are contained the samples of two measured signals and the variable fs indicating the sampling frequency
A)Signal 1 consists of two sinusoidal signals of which you are asked to calculate: -the duration ⇒ I thought is found by doing T=N/fs where N is the number of samples (in my case 512); -the two frequencies (enter in ascending order). I used the following Matlab commands to plot the Fourier transform:
s1=datafile1;
N=512;
f=(-fs/2):(fs/N):(fs/2-fs/N);
S1=fftshift(fft(s))
plot(f,abs(S1))
I got this
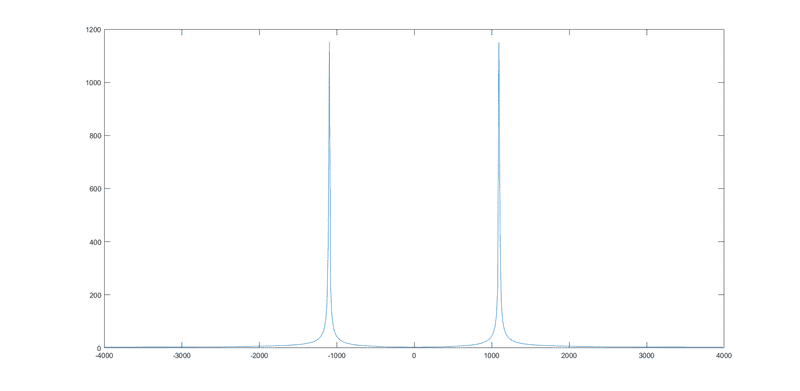
Is it right then to take as frequencies the ones I see in the two peaks(positive and negative with the same modulus)?
B)Signal 2 consists of the superposition of a larger number of sinusoidal signals. You are asked to identify the frequencies present by placing them in the boxes in ascending order(there are 6 boxes). If the number of frequencies identified is less than the number of boxes available, enter the value of the sampling frequency in the unnecessary boxes.
In the second case I get this
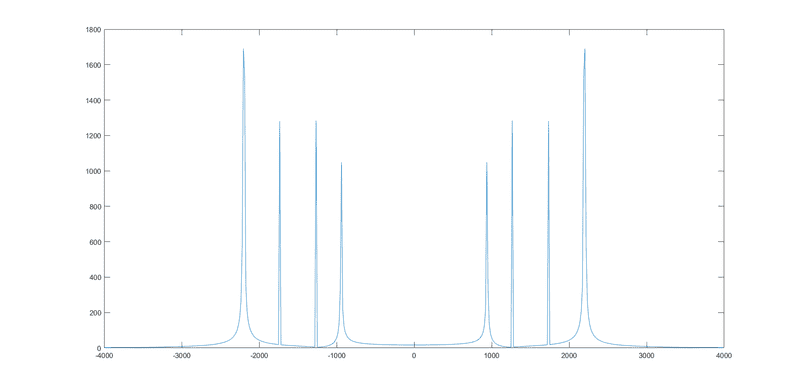
How do I choose the frequencies now if I have 8 peaks?
The mat file is provided below
Thanks to those who will help me
A)Signal 1 consists of two sinusoidal signals of which you are asked to calculate: -the duration ⇒ I thought is found by doing T=N/fs where N is the number of samples (in my case 512); -the two frequencies (enter in ascending order). I used the following Matlab commands to plot the Fourier transform:
s1=datafile1;
N=512;
f=(-fs/2):(fs/N):(fs/2-fs/N);
S1=fftshift(fft(s))
plot(f,abs(S1))
I got this
Is it right then to take as frequencies the ones I see in the two peaks(positive and negative with the same modulus)?
B)Signal 2 consists of the superposition of a larger number of sinusoidal signals. You are asked to identify the frequencies present by placing them in the boxes in ascending order(there are 6 boxes). If the number of frequencies identified is less than the number of boxes available, enter the value of the sampling frequency in the unnecessary boxes.
In the second case I get this
How do I choose the frequencies now if I have 8 peaks?
The mat file is provided below
Thanks to those who will help me
Attachments
Last edited by a moderator: