Discussion Overview
The discussion revolves around calculating the standard deviation from a given data table, focusing on statistical methods and formulas. Participants explore the necessary steps to compute the standard deviation, including calculating the mean and considering whether the data represents a sample or a population.
Discussion Character
- Homework-related
- Mathematical reasoning
- Technical explanation
- Debate/contested
Main Points Raised
- Some participants emphasize the need to calculate the sample mean before proceeding to standard deviation.
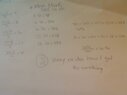
- One participant presents the formulas for mean and standard deviation, noting the importance of distinguishing between sample and population data.
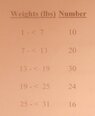
- There is a discussion about the correct interpretation of ranges for calculating the mean, with some participants averaging the midpoints of ranges.
- Several participants express uncertainty about the calculations and the correct application of formulas, particularly regarding the use of frequencies and whether to divide by \( n \) or \( n-1 \).
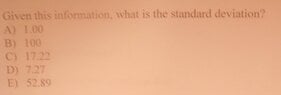
- One participant mentions a discrepancy in their calculated mean compared to given choices, prompting further discussion on calculation methods.
- Another participant provides a detailed example of calculating the squared differences from the mean, emphasizing the need to multiply by frequency.
- There is a clarification about the concept of "degrees of freedom" in relation to dividing by \( n-1 \) for sample data.
Areas of Agreement / Disagreement
Participants generally agree on the need to calculate the mean and the standard deviation, but there are multiple competing views on the correct approach to calculating these values, particularly regarding the treatment of sample versus population data and the interpretation of the data ranges. The discussion remains unresolved in terms of a definitive method, as participants express varying levels of confidence in their calculations.
Contextual Notes
Some participants express uncertainty about the assumptions underlying their calculations, such as whether the data represents a sample or a population, and how to interpret the ranges provided in the table. There are also unresolved mathematical steps regarding the calculations of means and standard deviations.