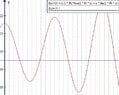
TI-84 Plus not graphing h(t)=20+(1/2π)cos(2πt)+t·sin(2πt) correctly

  • Topic:
  • Thread starter Thread starter Swizaw
  • Start date Start date
  • Tags Tags
    Graph
Join the discussion
Registration is free. Start your own thread to ask a follow-up.
4 replies · 16K views
Swizaw
Messages
2
Reaction score
0
Hello,my Ti 84 plus calculator from texas is showing incorrectly the graph,i can't find out why it's showing incorrectly.

The function is h(t)= 20+(1/2pi)cos(2pit)+tsen(2pit)

t is a variable representing the time
xmin is 0
xmax is 1.
ymin is 19.
ymax is 21
You have to intersect it after with 19,5.This exercise was on my maths 2016 exam (1st phase) and it's not showing the same graph as the resolution.
I attached the picture of what it should look like the correct one
And the one that shows on my calculator
https://imgur.com/M7eyuuP
 
Attachments
  • Screen Shot 2016-07-12 at 19.41.03.png
    Screen Shot 2016-07-12 at 19.41.03.png
    4.9 KB · Views: 186
Physics news on Phys.org
Found what what's wrong,i had to manually do 1/2pi which was like 0.16 and instead of putting 1/2pi i had to put 0.16,probably because it's in radian it was messing up something,you can lock the thread!
Thanks
 
Swizaw said:
Hello,my Ti 84 plus calculator from texas is showing incorrectly the graph,i can't find out why it's showing incorrectly.

The function is h(t)= 20+(1/2pi)cos(2pit)+tsen(2pit)

t is a variable representing the time
xmin is 0
xmax is 1.
ymin is 19.
ymax is 21
You have to intersect it after with 19,5.This exercise was on my maths 2016 exam (1st phase) and it's not showing the same graph as the resolution.
I attached the picture of what it should look like the correct one
And the one that shows on my calculator
https://imgur.com/M7eyuuP
Is there a typo in your original equation? I used a graphing program (see below) and I'm agreeing with your calculator. (In order to see the sinusoidal behavior that my graph displays you need to zoom out.) The vertical lines are 0.1 apart.

-Dan

View attachment 5709

Addendum: You wrote "Xsin(...)" on your calculator. Mine would call that the function Xsin() as opposed to X * sin(). Is this an error or does yours understand the intention?

- - - Updated - - -

topsquark said:
Is there a typo in your original equation? I used a graphing program (see below) and I'm agreeing with your calculator. (In order to see the sinusoidal behavior that my graph displays you need to zoom out.) The vertical lines are 0.1 apart.

-Dan
Addendum: You wrote "Xsin(...)" on your calculator. Mine would call that the function Xsin() as opposed to X * sin(). Is this an error or does yours understand the intention?

PS I just read your response above and I still don't agree with the supposed correct answer. The first "hump" in the graph doesn't exist and the correct graph has a zero around x = 0.31.
 
Attachments
  • Graph.jpg
    Graph.jpg
    27.4 KB · Views: 185
Typing $20+1/(2\pi)\cos(2\pi X)+X\sin(2\pi X)$ gives the desired graph (on my TI-84 Plus).
 
Last edited:
greg1313 said:
Typing $20+1/(2\pi)\cos(2\pi X)+X\sin(2\pi X)$ gives the desired graph (on my TI-84 Plus).
Oh! 0.16. I see it now.

-Dan