Swizaw
- 2
- 0
Hello,my Ti 84 plus calculator from texas is showing incorrectly the graph,i can't find out why it's showing incorrectly.
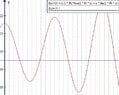
The function is h(t)= 20+(1/2pi)cos(2pit)+tsen(2pit)
t is a variable representing the time
xmin is 0
xmax is 1.
ymin is 19.
ymax is 21
You have to intersect it after with 19,5.This exercise was on my maths 2016 exam (1st phase) and it's not showing the same graph as the resolution.
I attached the picture of what it should look like the correct one
And the one that shows on my calculator
https://imgur.com/M7eyuuP