U.S. student performance in math, reading and science

1 reply · 2K views · last reply
bballwaterboy
Messages
85
Reaction score
3
http://www.usnews.com/news/blogs/da...students-stack-up-in-math-reading-and-science

Big report just came out!
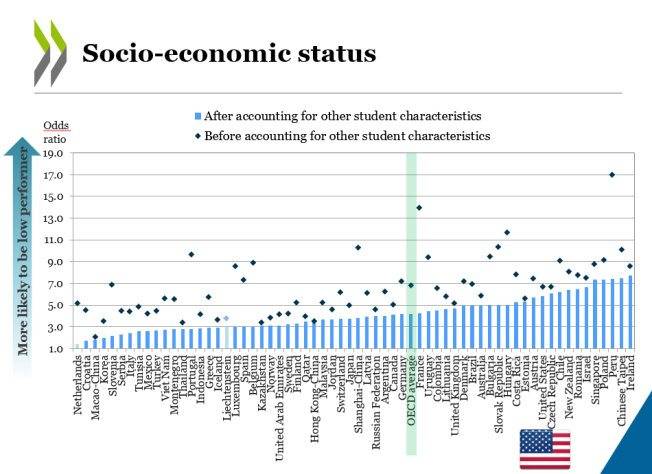
Bar and marker chart titled Socio-economic status, plotting odds ratio of being a low performer for countries from Netherlands to Ireland, with OECD average and United States highlighted.


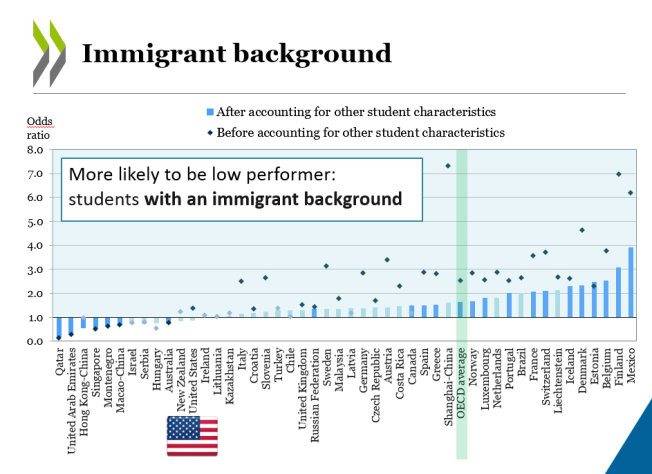
Bar and dot chart titled Immigrant background, plotting odds ratio of low performance for students with an immigrant background across countries, with the United States highlighted and OECD average marked.


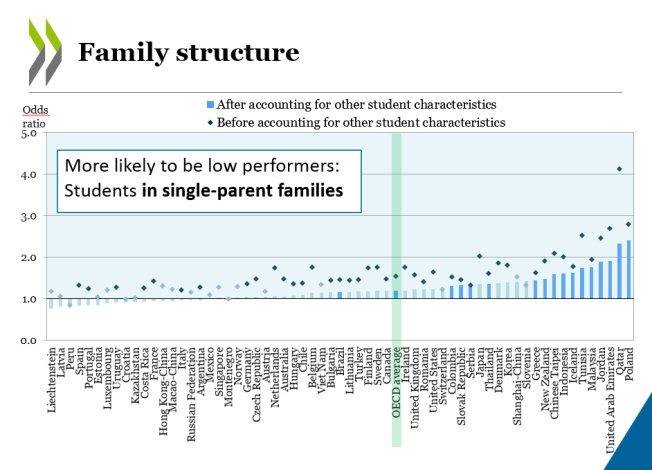
Bar and marker chart titled Family structure showing odds ratios of low performance for students in single-parent families across countries, from Liechtenstein to Poland, with the OECD average highlighted.


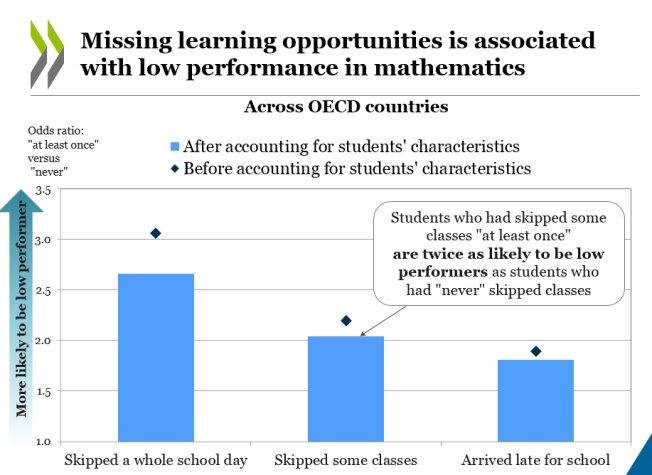
Bar chart titled 'Missing learning opportunities is associated with low performance in mathematics' showing odds ratios across OECD countries for skipping a whole school day, skipping some classes and arriving late for school, before and after accounting for students' characteristics.


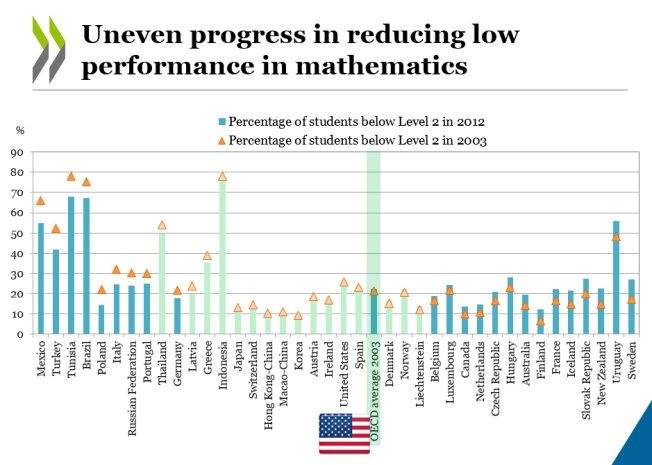
Bar and triangle chart titled Uneven progress in reducing low performance in mathematics, showing percentage of students below Level 2 in 2012 (blue bars) and 2003 (orange triangles) for many countries, with the OECD average 2003 highlighted and a US flag at the bottom.
 
"Bottom of the barrel" comparisons? Suppose we have to start somewhere, but "bottom of the barrel?"