Uncertainty of histogram bins from MC-simulation

  • Context: Undergrad 
  • Thread starter Thread starter minits
  • Start date Start date
  • Tags Tags
    Histogram Uncertainty
Click For Summary
SUMMARY

The discussion centers on the assignment of uncertainties to histogram bins derived from Monte Carlo (MC) simulations in particle physics. The user calculated differential cross sections for 10,000 phase-space points but struggled with applying the Poisson distribution for uncertainty estimation. Experts confirmed that the Poisson distribution is appropriate for counting events in histogram bins, emphasizing that the uncertainty should be calculated as the square root of the number of events in each bin, adjusted for weights. The conversation also highlighted the complexity introduced by weighted events and suggested further resources for understanding error propagation in this context.

PREREQUISITES
  • Monte Carlo simulation techniques in particle physics
  • Understanding of differential cross sections
  • Familiarity with histogram analysis
  • Basic knowledge of the Poisson distribution and error propagation
NEXT STEPS
  • Study the application of the Poisson distribution in histogram analysis
  • Learn about error propagation in weighted data
  • Explore resources on differential cross section calculations in particle physics
  • Investigate varied bin width analysis for uncertainty estimation
USEFUL FOR

Researchers and students in particle physics, data analysts working with Monte Carlo simulations, and anyone involved in statistical analysis of experimental data.

minits
Messages
12
Reaction score
0
TL;DR
How to determine the uncertainty of histogram bins when the entries result from a MC-simulation
Hello everyone,

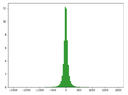
I calculated the matrix element of a parton level process and determined the total cross section via a MC-simulation. Then I wanted to look at some differential distributions like the differential cross section with respect to the energy of one of the particles in the final state. In order to do this I calculate the differential cross section for 10.000 phase-space points and then do a case analysis in which bin to add the respective result. Now I am stuck with assigning an uncertainty to each bin. How does this work? The differential cross sections do not carry any uncertainty since they are calculated analytically. One approach I often read is the use of the poissonian distibution but I do not think it is the proper way since I feel like I am not really doing a counting experiment. Thanks for any advice!
 
Physics news on Phys.org
Can you show us the histogram? If you want to protect your data, feel free to apply a blind to the axes. I'd just like a sense for how many points fall in each bin before I say something stupid.

I know next to nothing about the physics of what you're studying; however, I'm confused how you could be generating a histogram from MC results and not be doing a counting experiment? Can you explain why you think you're not doing counting? Where I'm going with this is that all histograms are counting. The Poissonian distribution tells you the estimated uncertainty on the number of MC results in each bin (in the appropriate limit of many MC results).
 
Here is the histogram you asked for. I am just not firm with the application of the poisson distribution since everyone says it kind of always applies in counting experiments but I still don't know why that is.
A second thing that I am unsure about is if the error from the MC ist poissonian I should take sqrt(N) as the errors for each bin but I have 10.000 events and in every event another number flows into one of the bins. So if I have 100 events flowing into one bin and the value of these events sum up to two the error won't be 10. So probably I should interpret the specific values as a weight which comlicates things.
 

Attachments

  • hist.PNG
    hist.PNG
    3.5 KB · Views: 245
Last edited:
Ok, seeing that I feel more confident saying Poisson is what you want.

I could give you my spiel about why the Poisson distribution is appropriate, but there are probably 1000's of folks online that have already given good explanations and put more time in than I would have. This video might be a good place to start.

The technical reason for why the poisson distribution is appropriate is that it is the limit of the binomial distribution as the number of trials goes to infinity and the mean number of successes is kept finite. Whenever you skim a few outcomes from a much larger pot of outcomes (raindrops on a roof, electrons over a threshold, photon shot noise, or points in a histogram bin), the Poisson distribution is what you need. If what you're asking is how you assign error bars to your histogram plot, take the square root of the number of points in each bin (that's the signature feature of the PD).
 
You are counting phase space points. If they are selected randomly then Poisson-like uncertainties should be right (your events have weights, so it's not a simple sqrt(N)). If they come from some grid then the uncertainty will be smaller. If computing power allows you can repeat the analysis with different grid patterns and compare the results to estimate the uncertainty.

Just from looking at your plot, bin-by-bin variations are probably very small.
 
  • Like
Likes   Reactions: Twigg
Thanks for your replies! I actually took the info for the uncertainties from the webseite you linked. However I did not understand the following equations:
var(w_i * 1 event) = w_i^2 * var(1 event) = w_i^2
Do you know why the these three expressions are equal? In the first relation why why is it the square of the weight? And after the second equal sign why is the variance of 1 event 1 and not 0? They also talk about
"poissonian fluctuation of the number of events" but where is this used explicitly?
 
I'm on my phone so forgive the lack of LaTeX.

The first equality is error propagation. Var[a*x] = a^2 Var[x]. The second is because for poissonian Var[N events] = N.
 

Similar threads

  • · Replies 9 ·
Replies
9
Views
3K
  • · Replies 3 ·
Replies
3
Views
8K
  • · Replies 3 ·
Replies
3
Views
2K
  • · Replies 0 ·
Replies
0
Views
2K
  • · Replies 2 ·
Replies
2
Views
1K
  • · Replies 2 ·
Replies
2
Views
2K
  • · Replies 33 ·
2
Replies
33
Views
3K
  • · Replies 3 ·
Replies
3
Views
2K
Replies
4
Views
2K
  • · Replies 48 ·
2
Replies
48
Views
5K