Understanding FTIR Peaks of PO4 Compounds

  • Thread starter Thread starter pink diamond
  • Start date Start date
  • Tags Tags
    Compounds Ftir
Join the discussion
Registration is free. Start your own thread to ask a follow-up.
1 reply · 14K views
pink diamond
Messages
3
Reaction score
0
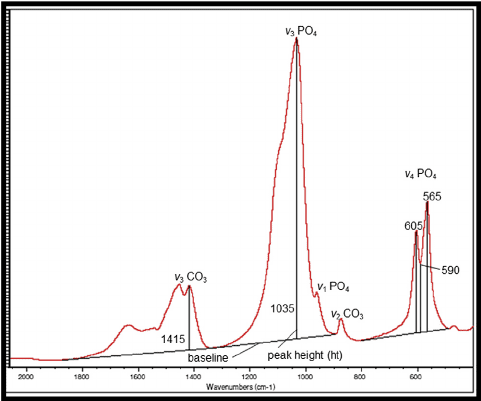
why on ftir graph there are several peaks for the same compound but at different wavelengths?
what causes the different modes of vibration for the same compound (PO4), what causes the v1 ,v3,v4 for PO4... help me please:frown:
upload_2017-4-14_12-59-58.png
 

Attachments

  • upload_2017-4-14_12-45-21.png
    upload_2017-4-14_12-45-21.png
    10.8 KB · Views: 675
  • upload_2017-4-14_12-52-5.png
    upload_2017-4-14_12-52-5.png
    10.8 KB · Views: 707
Engineering news on Phys.org
An IR spectrum is a molecule's fingerprint. Every unique compound will have its own IR spectrum. The various peaks depend on the individual bonds in the molecule. Then subdivide the number of unique bonds into stretching modes, symmetric stretching, asymmetric stretching, rocking, wagging, etc. Even simple molecules can have busy IR spectra.