- #1
fab13
- 312
- 6
Into an extra-galactic physics course, I don't understand well the "Gunn - Peterson" effect on the spectrum of high redshift quasars (z greater than 3 or 4, up to the current limit of z = 6-7 I think)
The observed fact is that there is an almost total absorption for the photons of the blue part of the Lyman-alpha line (1216 Angstrom). This is illustrated on the following 2 spectra:
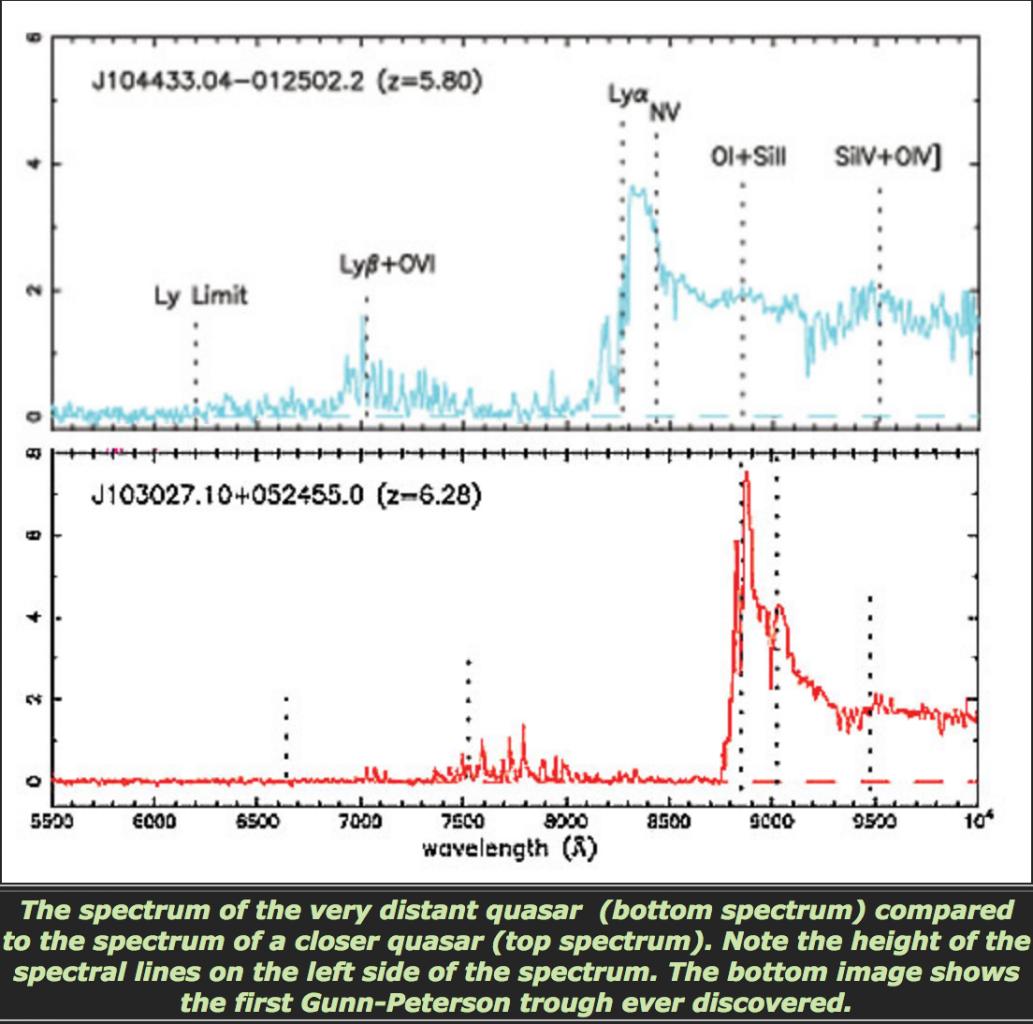
You can see on the 2 spectra that for wavelengths lower than the Lyman-alpha emission line (1216 Angstrom) :
1) is the near surrounding of quasar is a thin or thick medium : since the Lyman-alpha seems to be an emission line (1216 Angstrom), I would say a first sight, that surrounding medium of quasar is thin.
2) Does the large "plateau" reflect the absorption of all photons in this range of lengths. 'wave ?
There are a few emission lines but a low height.
I have seen from my research that this absorption up to z = 6 would translate the end of the reionization epoch, that is to say the time when the first stars were formed and which ionized again the hydrogen atoms (after the first ionization that took place before the recombination):
3) I don't understand this relation between "end of the reionization" and all the blue part, before the line Lyman-alpha of the observed spectrum, which is absorbed.
The video below shows the evolution of the spectrum during the course of a flow of photons from the far quasar which is slowly redshifting while showing the absorption lines of the Lyman forest :
4) We don't see Lyman forest on the 2 spectrum at the beginning of my post, do we ?
I understand that the hydrogen placed near the Lyman-alpha line is absorbed because the hydrogen gas close to the quasar absorbs the photons of the quasar, but :
5) What about the photons of shorter wavelengths? why do not they appear in the spectrum observed?
If, according to the line of sight, there are H+ ionized hydrogen atoms, then the quasar photons should not be absorbed, right? it would mean that there is little H+ on the line of sight, and so we could make the connection between the low density of H+ and the end of the reionization?
any help in understanding this effect is welcome.
The observed fact is that there is an almost total absorption for the photons of the blue part of the Lyman-alpha line (1216 Angstrom). This is illustrated on the following 2 spectra:
You can see on the 2 spectra that for wavelengths lower than the Lyman-alpha emission line (1216 Angstrom) :
1) is the near surrounding of quasar is a thin or thick medium : since the Lyman-alpha seems to be an emission line (1216 Angstrom), I would say a first sight, that surrounding medium of quasar is thin.
2) Does the large "plateau" reflect the absorption of all photons in this range of lengths. 'wave ?
There are a few emission lines but a low height.
I have seen from my research that this absorption up to z = 6 would translate the end of the reionization epoch, that is to say the time when the first stars were formed and which ionized again the hydrogen atoms (after the first ionization that took place before the recombination):
3) I don't understand this relation between "end of the reionization" and all the blue part, before the line Lyman-alpha of the observed spectrum, which is absorbed.
The video below shows the evolution of the spectrum during the course of a flow of photons from the far quasar which is slowly redshifting while showing the absorption lines of the Lyman forest :
4) We don't see Lyman forest on the 2 spectrum at the beginning of my post, do we ?
I understand that the hydrogen placed near the Lyman-alpha line is absorbed because the hydrogen gas close to the quasar absorbs the photons of the quasar, but :
5) What about the photons of shorter wavelengths? why do not they appear in the spectrum observed?
If, according to the line of sight, there are H+ ionized hydrogen atoms, then the quasar photons should not be absorbed, right? it would mean that there is little H+ on the line of sight, and so we could make the connection between the low density of H+ and the end of the reionization?
any help in understanding this effect is welcome.