Why no vertical lines when drawing this graph

2 replies · 1K views · last reply
member 731016
Homework Statement
Please see below
Relevant Equations
Please see below
For this problem,
Line graph of electric potential V in volts against position x in cm: V rises from 0 at x=0 to 20 V at x=1, stays at 20 V to x=3, then falls back to 0 at x=4.
,
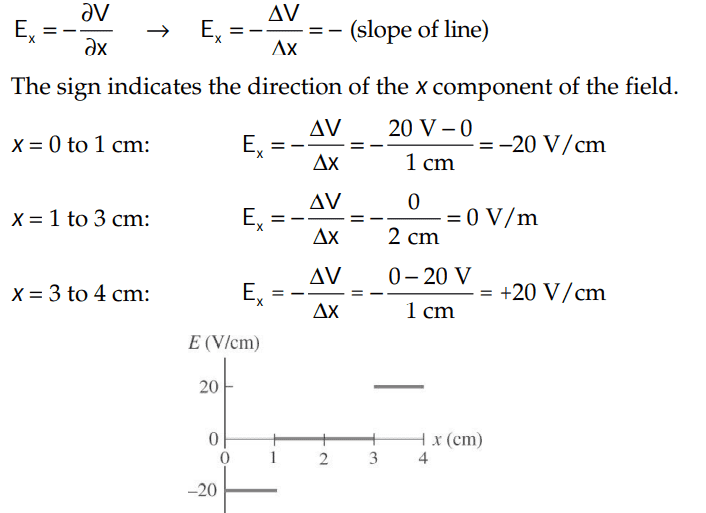
The solutions is,
Step-by-step calculation of Ex = -dV/dx as -(slope of V versus x) over three intervals, giving -20 V/cm, 0 V/m and +20 V/cm, with a step graph of Ex in V/cm against x in cm.

However, why did they not draw vertical lines for the graph like this:
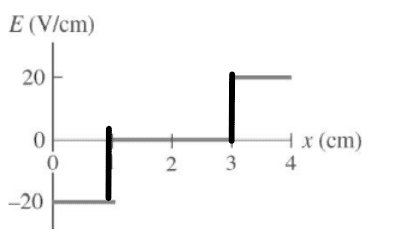
Step graph of E (V/cm) against x (cm): E is -20 from x=0 to about x=1, jumps to 0 until x=3, then rises to 20 and stays at 20 up to x=4, with thick black vertical segments marking the jumps.
?

Thank you!
 
Callumnc1 said:
However, why did they not draw vertical lines for the graph like this:
Because the electric field is discontinuous at x = 1 cm and x = 3 cm and that is how discontinuous functions are plotted. Drawing a line as you suggest implies that the electric field has all the in-between values which it doesn't.
 
  • Like
Likes   Reactions: member 731016
kuruman said:
Because the electric field is discontinuous at x = 1 cm and x = 3 cm and that is how discontinuous functions are plotted. Drawing a line as you suggest implies that the electric field has all the in-between values which it doesn't.
Got it, thank you @kuruman !