leprofece
- 239
- 0
First of all I see we have an editor latex so my friend markflo I won't have morre problems
But my problem is about a graph
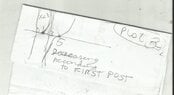
Plot a continue function graph with the following data o properties
f(1)= 0
f of first derivative in (3) = \infty
f of first derivative in (5) = 0
first derivative (x) > 0 in x <3 and x > 5
first derivative (x) < 0 in 3<x<5
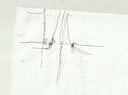
second derivative (x) > 0 in - in \infty<x<+\inftyI got The plot in the image shown
an asintote in 3 and go to \infty in both sides left to 3 and right to 3 View attachment 2679
Am I right?? anything wrong in my plot ?
But my problem is about a graph
Plot a continue function graph with the following data o properties
f(1)= 0
f of first derivative in (3) = \infty
f of first derivative in (5) = 0
first derivative (x) > 0 in x <3 and x > 5
first derivative (x) < 0 in 3<x<5
second derivative (x) > 0 in - in \infty<x<+\inftyI got The plot in the image shown
an asintote in 3 and go to \infty in both sides left to 3 and right to 3 View attachment 2679
Am I right?? anything wrong in my plot ?
Attachments
Last edited:
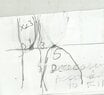
 The conditions say that the derivative should be positive for $x<3$ and negative for $3<x<5$. That seems to mean that the graph must go up to $+\infty$ and then come down from $+\infty$. Also, the second derivative condition implies that the graph must always have a leftward turn to it as you travel along the curve.