MHB Create an equation for the graph using the y = ae^(bx)cos(cx)

  • Thread starter Thread starter em2682
  • Start date Start date
  • Tags Tags
    Graph
Click For Summary
SUMMARY

The discussion focuses on creating an equation for a graph using the formula y = ae^(bx)cos(cx). Participants analyze the parameters a, b, c, d, and f, concluding that for the function to oscillate between 140 and 100, a non-zero vertical shift (f) is necessary. The derived equation is y(x) = (35/2)((3/7)^(x/50) + (3/7))cos((π/5)x) + (245/2), with specific values for a, b, and d calculated based on amplitude and decay characteristics. The discussion emphasizes the importance of understanding amplitude, decay, and frequency in modeling the graph accurately.

PREREQUISITES
  • Understanding of exponential functions and their properties
  • Knowledge of trigonometric functions, specifically cosine
  • Familiarity with mathematical modeling and graph interpretation
  • Ability to manipulate and solve equations involving logarithms and exponents
NEXT STEPS
  • Study the derivation of oscillatory motion equations in physics
  • Learn about the impact of vertical shifts in trigonometric functions
  • Explore the use of decay functions in signal processing
  • Investigate the application of TikZ/pgfplots for graphing mathematical functions
USEFUL FOR

Mathematicians, physicists, engineers, and students involved in modeling oscillatory systems or analyzing waveforms will benefit from this discussion.

em2682
Messages
4
Reaction score
0
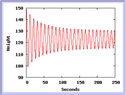
create an equatio for the graph using the y = ae^(bx)cos(cx) for the following graph
View attachment 8085
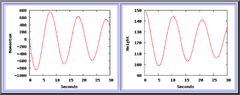
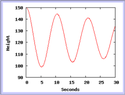
 

Attachments

  • Desmos.png
    Desmos.png
    4.5 KB · Views: 128
Mathematics news on Phys.org
It appears to me that you need something of the form:

$$y=a\left(e^{bx}+d\right)\cos(cx)+f$$
 
I am inclined to think that MarkFL's "d" could be 0 but "f" clearly can't be. Without a non-zero f, the first loop of the function would go from a down to -a but you want it to go from 140 to 100. The average of those two is 120 so you want it to go from 120+ 20 to 120- 20.
 
Country Boy said:
I am inclined to think that MarkFL's "d" could be 0 but "f" clearly can't be. Without a non-zero f, the first loop of the function would go from a down to -a but you want it to go from 140 to 100. The average of those two is 120 so you want it to go from 120+ 20 to 120- 20.

If $d=0$ and presumably $b<0$, then what would prevent the amplitude from tending to zero as $x\to\infty$, instead of some value greater than zero?
 
MarkFL said:
If $d=0$ and presumably $b<0$, then what would prevent the amplitude from tending to zero as $x\to\infty$, instead of some value greater than zero?

are your able to work at the actual equation and show working?

- - - Updated - - -

Country Boy said:
I am inclined to think that MarkFL's "d" could be 0 but "f" clearly can't be. Without a non-zero f, the first loop of the function would go from a down to -a but you want it to go from 140 to 100. The average of those two is 120 so you want it to go from 120+ 20 to 120- 20.

are your able to work at the actual equation and show working?

- - - Updated - - -

MarkFL said:
It appears to me that you need something of the form:

$$y=a\left(e^{bx}+d\right)\cos(cx)+f$$

are your able to work at the actual equation and show working?
 
Well, that's a tiny graph, which isn't very easy to read.

I would begin with the amplitude $$A(x)=a\left(e^{bx}+d\right)$$

Let's say:

$$A(0)=a\left(1+d\right)=25\tag{1}$$

$$A(50)=a\left(e^{50b}+d\right)=15\tag{2}$$

$$A(\infty)=ad=\frac{15}{2}\tag{3}$$

(1) and (3) imply:

$$a=\frac{35}{2},\,d=\frac{3}{7}$$

And so, substituting these values into (2), we find:

$$\frac{35}{2}\left(e^{50b}+\frac{3}{7}\right)=15$$

$$b=\frac{1}{50}\ln\left(\frac{3}{7}\right)$$

And so we have:

$$A(x)=\frac{35}{2}\left(\left(\frac{3}{7}\right)^{\Large\frac{x}{50}}+\frac{3}{7}\right)$$

The period appears to be about $10\text{ s}$ and the vertical shift is $$f=\frac{245}{2}$$ and so we have:

$$y(x)=\frac{35}{2}\left(\left(\frac{3}{7}\right)^{\Large\frac{x}{50}}+\frac{3}{7}\right)\cos\left(\frac{\pi}{5}x\right)+\frac{245}{2}$$

[DESMOS]advanced: {"version":5,"graph":{"squareAxes":false,"viewport":{"xmin":0,"ymin":80,"xmax":250,"ymax":160}},"expressions":{"list":[{"id":"1","type":"expression","latex":"y=\\frac{35}{2}\\left(\\left(\\frac{3}{7}\\right)^{\\frac{x}{50}}+\\frac{3}{7}\\right)\\cos\\left(\\frac{\\pi}{5}x\\right)+\\frac{245}{2}","color":"#c74440"}]}}[/DESMOS]
 
MarkFL said:
Well, that's a tiny graph, which isn't very easy to read.

I would begin with the amplitude $$A(x)=a\left(e^{bx}+d\right)$$

Let's say:

$$A(0)=a\left(1+d\right)=25\tag{1}$$

$$A(50)=a\left(e^{50b}+d\right)=15\tag{2}$$

$$A(\infty)=ad=\frac{15}{2}\tag{3}$$

(1) and (3) imply:

$$a=\frac{35}{2},\,d=\frac{3}{7}$$

And so, substituting these values into (2), we find:

$$\frac{35}{2}\left(e^{50b}+\frac{3}{7}\right)=15$$

$$b=\frac{1}{50}\ln\left(\frac{3}{7}\right)$$

And so we have:

$$A(x)=\frac{35}{2}\left(\left(\frac{3}{7}\right)^{\Large\frac{x}{50}}+\frac{3}{7}\right)$$

The period appears to be about $10\text{ s}$ and the vertical shift is $$f=\frac{245}{2}$$ and so we have:

$$y(x)=\frac{35}{2}\left(\left(\frac{3}{7}\right)^{\Large\frac{x}{50}}+\frac{3}{7}\right)\cos\left(\frac{\pi}{5}x\right)+\frac{245}{2}$$

View attachment 8093
Does this help or change the values?
 

Attachments

  • Desmos Close.png
    Desmos Close.png
    7.5 KB · Views: 113
  • Desmos Close.png
    Desmos Close.png
    6.9 KB · Views: 125
Last edited:
Here's a slightly different approach.

It looks like the signal that may come from an oscilloscope.
For such a signal it is not unusual that an offset was added to the original signal to get it nicely on the screen.
That means that yes, it has an offset, but we don't care about the offset.

What we typically want to know, is:
  1. The initial amplitude $A_0$.
  2. The characteristic time $\tau$ that the amplitude decays with a factor $e^{-1}$.
  3. The angular frequency $\omega$.
The first top is at $t=0$, which is $150$. The second top is $145$, so it decays about $\frac {150-145}2 \approx 2.5$ in the first half cycle.
The first bottom is at $99$. Subtract $2.5$ (slightly round up) to compensate, and we get $96$.

So:
$$A_0 = \frac{150 - 96}{2} = 27 \tag 1$$
The offset is then at
$$\text{Height offset} = \frac{150+96}{2} = 123 \tag 2$$

At the characteristic time $\tau$, we will have a height of $123 \pm \frac{27}{e} = 123 \pm \frac{27}{2.71} = 123\pm 10$.
Read the graph to see where heights $113$ and $133$ are, which is a bit difficult. I'll estimate
$$\tau=100 \text{ s} \tag 3$$
since it does seem we have nice round numbers in this exercise. After all, $27$ divides very nicely by $e\approx 2.71$.

Finally, following top-to-top, we have $24$ cycles in $250 \text{ s}$.
(I recounted to check if I was 1 off, but apparently I was not.)
That gives us:
$$\omega = 2\pi f= 2\pi\cdot\frac{24}{250} = 0.60\text{ rad/s} \tag 4$$

So we get:
$$A_0\, e^{-t/\tau}\cos(\omega t) = 27\,e^{-t/100}\cos(0.60\,t) \tag 5$$
Matching it with the given formula $ae^{bx}\cos{cx}$ gives us:
$$a=27,\ b=-0.010\text{ s}^{-1},\ c=0.60\text{ rad/s} \tag 6$$

With TikZ/pgfplots and its default settings (apparently the original image was made the same way):
\begin{tikzpicture}
%preamble \usepackage{pgfplots}
\begin{axis}[xlabel={Seconds},ylabel={Height},ytick distance=10,xmin=0,xmax=250,ymin=90,ymax=150]
\addplot[red, smooth, thick, samples=1000, domain=0:250] (x, {27 * exp(-0.010 * x) * cos(deg(0.60 * x)) + 123});
\end{axis}
\end{tikzpicture}
Here's the original image for comparison:
https://www.physicsforums.com/attachments/8085

As we can see, the given formula does not match as MarkFL and Country Boy already indicated.
It doesn't decay to zero amplitude, but it seems to decay to some fixed amplitude.
Conclusion: the given formula does not describe the measured signal.
 
MarkFL said:
Well, that's a tiny graph, which isn't very easy to read.

I would begin with the amplitude $$A(x)=a\left(e^{bx}+d\right)$$

Let's say:

$$A(0)=a\left(1+d\right)=25\tag{1}$$

$$A(50)=a\left(e^{50b}+d\right)=15\tag{2}$$

$$A(\infty)=ad=\frac{15}{2}\tag{3}$$

(1) and (3) imply:

$$a=\frac{35}{2},\,d=\frac{3}{7}$$

And so, substituting these values into (2), we find:

$$\frac{35}{2}\left(e^{50b}+\frac{3}{7}\right)=15$$

$$b=\frac{1}{50}\ln\left(\frac{3}{7}\right)$$

And so we have:

$$A(x)=\frac{35}{2}\left(\left(\frac{3}{7}\right)^{\Large\frac{x}{50}}+\frac{3}{7}\right)$$

The period appears to be about $10\text{ s}$ and the vertical shift is $$f=\frac{245}{2}$$ and so we have:

$$y(x)=\frac{35}{2}\left(\left(\frac{3}{7}\right)^{\Large\frac{x}{50}}+\frac{3}{7}\right)\cos\left(\frac{\pi}{5}x\right)+\frac{245}{2}$$
thank you so much! what were some importnt assumptions made to determine the equation?
 
  • #10
em2682 said:
thank you so much! what were some importnt assumptions made to determine the equation?

All the assumptions were posted.
 

Similar threads

  • · Replies 3 ·
Replies
3
Views
2K
  • · Replies 5 ·
Replies
5
Views
1K
  • · Replies 2 ·
Replies
2
Views
1K
  • · Replies 3 ·
Replies
3
Views
2K
  • · Replies 2 ·
Replies
2
Views
1K
  • · Replies 1 ·
Replies
1
Views
1K
  • · Replies 7 ·
Replies
7
Views
1K
  • · Replies 16 ·
Replies
16
Views
5K
Replies
4
Views
1K
Replies
2
Views
2K