Diagnosing an Error in my String Wave Solution

Click For Summary
SUMMARY

The discussion centers on diagnosing an error in a string wave solution for a clamped, uniform string under tension \(T\). The initial transverse velocity distribution is defined by a delta function, leading to a derived solution involving a Fourier series. The user questions the correctness of the solution and the resulting plot, particularly regarding the amplitude behavior over time. Additionally, they seek clarification on calculating the energy of each mode in the context of the wave equation.

PREREQUISITES
  • Understanding of wave equations and boundary conditions
  • Familiarity with Fourier series and their applications in solving differential equations
  • Knowledge of delta functions and their role in initial conditions
  • Basic principles of energy in wave mechanics
NEXT STEPS
  • Review the derivation of the wave equation for a clamped string under tension
  • Learn how to calculate energy for each mode in a vibrating string using the formula for energy density
  • Investigate the implications of delta functions on initial conditions and their effects on wave behavior
  • Examine numerical methods for plotting solutions to wave equations over time
USEFUL FOR

Physicists, engineers, and students studying wave mechanics, particularly those working with string vibrations and Fourier analysis.

Dustinsfl
Messages
2,217
Reaction score
5
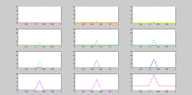
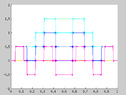
My plot seems wrong so I am not sure what the problem is: (a) mistake in sol (b) mistake in coding.

A clamped, uniform string under tension \(T\) has length \(\ell\). The string is struck in the middle, giving an initial tranverse velocity distribution
\[
\dot{u}(x, 0) = \delta(x - 1/2).
\]
So the solution I obtained:
\[
u(x, t) = \frac{2}{\pi}\sum_{n=1}^{\infty}\frac{1}{n} \sin\left(\frac{n \pi}{2}\right) \sin(n\pi x)\sin(n\pi t)
\]
Is the solution correct? If so, is the plot correct?

Also, how do I find the energy of each mode?

View attachment 1508
 

Attachments

  • Screenshot from 2013-10-19 00:41:09.png
    Screenshot from 2013-10-19 00:41:09.png
    2.2 KB · Views: 139
Last edited:
Physics news on Phys.org
Here is the plot t = 0:0.01:0.11.

We can see that the amplitude grows as time grows. Shouldn't the amplitude spike since it is a delt function then decay?

View attachment 1510
 

Attachments

  • Screenshot from 2013-10-19 11:43:29.png
    Screenshot from 2013-10-19 11:43:29.png
    5.5 KB · Views: 131
Does the wording under tension \(T\) something to the equation I am missing?
 

Similar threads

  • · Replies 7 ·
Replies
7
Views
3K
  • · Replies 2 ·
Replies
2
Views
2K
  • · Replies 11 ·
Replies
11
Views
4K
  • · Replies 2 ·
Replies
2
Views
2K
Replies
1
Views
2K
  • · Replies 7 ·
Replies
7
Views
3K
  • · Replies 4 ·
Replies
4
Views
2K
  • · Replies 1 ·
Replies
1
Views
3K
Replies
2
Views
2K
  • · Replies 2 ·
Replies
2
Views
2K