SUMMARY
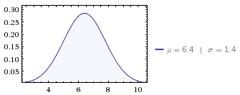
The discussion centers on displaying patient stay data on a normal curve, specifically for a hospital's abdominal surgery patients. A sample of 15 patients yielded a sample mean of 6.4 days and a sample standard deviation of 1.4 days. The normal curve is characterized by these parameters, illustrating the distribution of patient stay durations effectively. This visualization aids in understanding patient stay patterns and can inform hospital resource planning.
PREREQUISITES
- Understanding of normal distribution concepts
- Familiarity with statistical terms such as mean and standard deviation
- Basic knowledge of data visualization techniques
- Experience with statistical software or tools for graphing
NEXT STEPS
- Learn how to create normal distribution graphs using Python's Matplotlib library
- Explore statistical analysis techniques for sample data interpretation
- Study the implications of standard deviation in healthcare statistics
- Investigate tools for visualizing statistical data, such as R or Excel
USEFUL FOR
Healthcare analysts, statisticians, data scientists, and hospital administrators interested in analyzing and visualizing patient stay data.