Discussion Overview
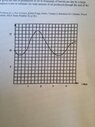
The discussion centers around estimating oil production using Simpson's rule based on a graph of production rates. Participants explore the application of numerical integration techniques over a specified time period, addressing the number of intervals and the interpretation of the graph.
Discussion Character
- Mathematical reasoning
- Debate/contested
- Technical explanation
Main Points Raised
- One participant calculates an estimate of total oil production using Simpson's rule with a specific formula, yielding approximately 44.17.
- Another participant suggests using 20 intervals by extrapolating the data, questioning the interpretation of the graph and the number of intervals needed.
- A different participant expresses confusion about the number of intervals, suggesting that the integration should only consider up to the fourth day, leading to a different interpretation of the intervals.
- One participant clarifies that no extrapolation is needed and agrees with the original ending value, indicating a preference for using 16 sub-intervals for accuracy.
- Another participant questions the necessity of using 16 sub-intervals, arguing that using fewer intervals yielded a similar result, prompting a discussion about the significance of accuracy in approximations.
- Some participants discuss personal preferences for approximation methods, with one stating that using more intervals generally leads to better accuracy.
- A later reply confirms that while the original method is not wrong, it may not be as accurate, depending on the desired precision of the estimate.
Areas of Agreement / Disagreement
Participants express differing views on the number of intervals to use and the interpretation of the graph. There is no consensus on the best approach, with multiple competing views remaining regarding the application of Simpson's rule in this context.
Contextual Notes
Some participants note potential confusion regarding the definition of intervals and the interpretation of the graph, which may affect the calculations. The discussion reflects varying assumptions about the integration limits and the number of sub-intervals.
Who May Find This Useful
Readers interested in numerical methods for integration, particularly in the context of estimating production rates or similar applications in engineering and mathematics.
 There is no extrapolation required and your ending value ($P(4)$) is correct. I was using $P(t)$ to represent the function being plotted (P for production). So, if I was working this problem, I would want 16 sub-intervals ($n$=16) or 8 parabolic arcs.