chwala
Gold Member
- 2,854
- 436
- Homework Statement
- see attached
- Relevant Equations
- t distribution
I am refreshing on this...

I think there is a mistake on the circled part in red...right? not correct symbol for sample mean...This is the part that i need clarity on.
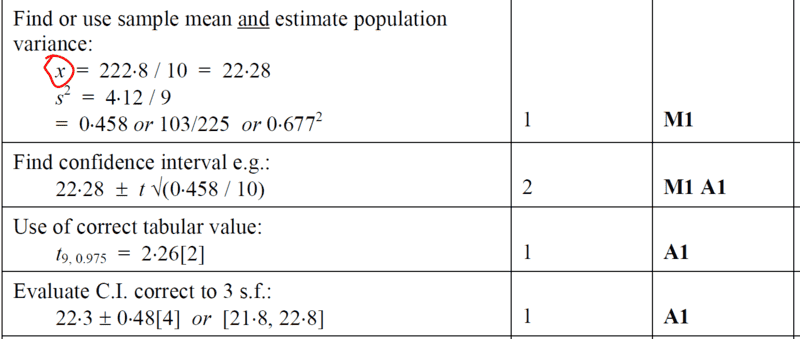
The other steps to solution are pretty easy to follow...as long as one knows the t-formula and also the knowledge to interpret the t-distribution table with dof_{1} = ##9## and significance level i.e dof_{2}= ##0.025## that gives us the desired ##2.262##.
cheers
I think there is a mistake on the circled part in red...right? not correct symbol for sample mean...This is the part that i need clarity on.
The other steps to solution are pretty easy to follow...as long as one knows the t-formula and also the knowledge to interpret the t-distribution table with dof_{1} = ##9## and significance level i.e dof_{2}= ##0.025## that gives us the desired ##2.262##.
cheers