SUMMARY
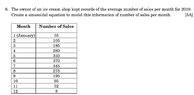
The discussion focuses on determining the period of a sinusoidal model for ice cream sales based on monthly sales data from 2019. The user, Dan, has identified the maximum and minimum sales figures and is seeking to calculate the K-value necessary to apply the formula for the period, which is defined as 2π/k. Dan notes that the time span from January to November represents the first half of a sine wave, indicating that the full period can be inferred from this data.
PREREQUISITES
- Understanding of sinusoidal functions and their properties
- Familiarity with the concept of K-value in sinusoidal equations
- Basic knowledge of trigonometric functions
- Experience with data analysis and interpretation of sales trends
NEXT STEPS
- Research how to derive the K-value from given data points in sinusoidal models
- Explore the application of sinusoidal equations in real-world sales forecasting
- Learn about the implications of amplitude and phase shift in sinusoidal functions
- Study the use of graphing tools to visualize sinusoidal models for data analysis
USEFUL FOR
Business analysts, data scientists, and anyone involved in sales forecasting or modeling seasonal trends using sinusoidal functions.