Wooody
- 2
- 0
Hello,
First post here. I have some data I am trying to do some forecasting on and was hoping somebody who knows what they're actually doing can verify what I have done. A few years ago, the company I work for developed a mobile app for its customers and about 1 year ago they added some new features. The CTO came to me and asked me "Can you please give me a 12 month estimate on the number of customers using our mobile app?" and the data I have access to is:
(1) The number of customers registered each day for the last 8 years
(2) The number of customers who used their customerId in the app for the last 2 yearsThe first thing I thought I should do is just use simple linear regression on (2) for the forecast. Here is a rough representation of what that data looks like:
View attachment 9308
Firstly, if I was going to do a trend line here, would it be the right thing to do to just look at the data from around Jan of this year onwards where there is an obvious increase that aligns with the new features added to the app about a year ago (the red box below)?
View attachment 9309
Then I thought about another way to do this which is to for each date, determine the total number of customers for each date (a rolling number) and the number of customers using their Id in the app on each date (rolling) so I could determine the number of customers using the app with their customerId as a percentage of total patients (called Participation Rate). A dummy dataset is as follows:
View attachment 9310
With this dataset I would do regression on the number of Total Customers and predict that in 12 months and do regression on the participation rate to predict that in 12 months and then simply multiply the two forecasted numbers together. Is this a sound approach? If not is there a better way to achieve this?
Thanks
First post here. I have some data I am trying to do some forecasting on and was hoping somebody who knows what they're actually doing can verify what I have done. A few years ago, the company I work for developed a mobile app for its customers and about 1 year ago they added some new features. The CTO came to me and asked me "Can you please give me a 12 month estimate on the number of customers using our mobile app?" and the data I have access to is:
(1) The number of customers registered each day for the last 8 years
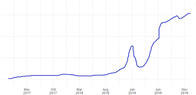
(2) The number of customers who used their customerId in the app for the last 2 yearsThe first thing I thought I should do is just use simple linear regression on (2) for the forecast. Here is a rough representation of what that data looks like:
View attachment 9308
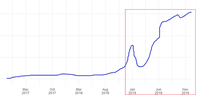
Firstly, if I was going to do a trend line here, would it be the right thing to do to just look at the data from around Jan of this year onwards where there is an obvious increase that aligns with the new features added to the app about a year ago (the red box below)?
View attachment 9309
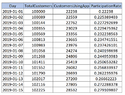
Then I thought about another way to do this which is to for each date, determine the total number of customers for each date (a rolling number) and the number of customers using their Id in the app on each date (rolling) so I could determine the number of customers using the app with their customerId as a percentage of total patients (called Participation Rate). A dummy dataset is as follows:
View attachment 9310
With this dataset I would do regression on the number of Total Customers and predict that in 12 months and do regression on the participation rate to predict that in 12 months and then simply multiply the two forecasted numbers together. Is this a sound approach? If not is there a better way to achieve this?
Thanks