zak100
- 462
- 11
- TL;DR
- I am facing problem in creating a graph using MS Excel. I have got fractional data. Also the graph which is created by MS excel ignores some fields.
Hi,
I want to create a graph from the following data. The data is related to 3 different computers but the fields are same:
Please provide me the steps.
Garph1 BS
CPU Percentage 12
Memory Usage 15773696
sdiskusage total 9.82901E+11
sdiskusage used 1.41429E+11
sdisk usage free 7.91472E+11
sdisk usage percentage 15.2
virtual Memory 10234679296
rss 15773696
Time 1.026669979
Graph2 SS
CPU Percentage 2
Memory Usage 15769600
sdiskusage total 9.82901E+11
sdiskusage used 1.41429E+11
sdisk usage free 7.91472E+11
sdisk usage percentage 15.2
virtual Memory 10545913856
rss 15769600
Time 1.026956081
Graph3 BSBS
CPU Percentage 12
Memory Usage 15773696
sdiskusage total 9.82901E+11
sdiskusage used 1.41429E+11
sdisk usage free 7.91472E+11
sdisk usage percentage 15.2
virtual Memory 10234679296
rss 15773696
Time 1.071877241
Zulfi.
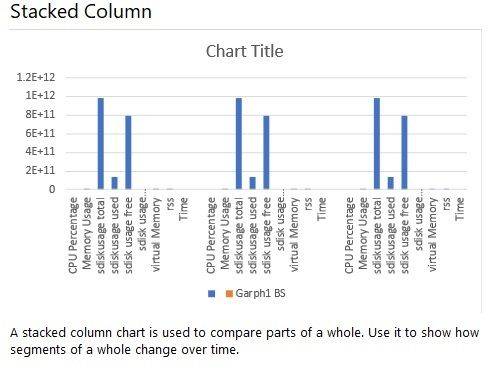
I want to create a graph from the following data. The data is related to 3 different computers but the fields are same:
Please provide me the steps.
Garph1 BS
CPU Percentage 12
Memory Usage 15773696
sdiskusage total 9.82901E+11
sdiskusage used 1.41429E+11
sdisk usage free 7.91472E+11
sdisk usage percentage 15.2
virtual Memory 10234679296
rss 15773696
Time 1.026669979
Graph2 SS
CPU Percentage 2
Memory Usage 15769600
sdiskusage total 9.82901E+11
sdiskusage used 1.41429E+11
sdisk usage free 7.91472E+11
sdisk usage percentage 15.2
virtual Memory 10545913856
rss 15769600
Time 1.026956081
Graph3 BSBS
CPU Percentage 12
Memory Usage 15773696
sdiskusage total 9.82901E+11
sdiskusage used 1.41429E+11
sdisk usage free 7.91472E+11
sdisk usage percentage 15.2
virtual Memory 10234679296
rss 15773696
Time 1.071877241
Zulfi.
Last edited by a moderator: