Graphs of Negative Fractional Powers x^(-p/q)

Join the discussion
Registration is free. Start your own thread to ask a follow-up.
1 reply · 2K views
confusedatmath
Messages
14
Reaction score
0
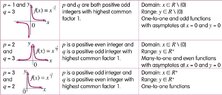
Can someone explain how these graphs are drawn. How does the value of p/q affect this graph? How does the domain and range change? How are the asymptotes found?

The below is an image about what I'm talking about:

View attachment 1831

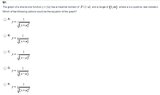
Here is a question the deals with this type of graph (no idea how to solve it because I'm unfamiliar with these kind of graphs)

View attachment 1832
 
Attachments
  • q1a.jpg
    q1a.jpg
    45.6 KB · Views: 207
  • q1b.jpg
    q1b.jpg
    16.4 KB · Views: 154
Mathematics news on Phys.org
Think about the domain as where the function is defined. For example, if you think of a fraction with a polynomial in the denominator then it it is defined for all numbers except for the zeros of this polynomial. If you have a square root then it has to be defined for only positive integers. If you have both then you have to take care of both conditions. As for the range it is a little bit tricker to work with but for the most time you can guess it.

Take the following example

$$f(x)=\frac{1}{x+a}$$

What is the domain, range and horizontal and vertical asymptotes ?