Graphs of Functions with fractional powers x^(p/q)

Join the discussion
Registration is free. Start your own thread to ask a follow-up.
2 replies · 2K views
confusedatmath
Messages
14
Reaction score
0
Can someone explain the following:

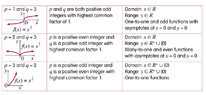
How does changing the value of p/q affect the drawing of the graph (so domain/range/shape etc)
What makes this graph an odd function?
How to work out asymptotes?

Heres a picture so you know what I'm referring to:

View attachment 1825

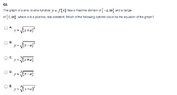
And below is a question dealing with this type of function. Can someone please refer to the explanations on how to go about solving these questions.

View attachment 1824
 
Attachments
  • Screen Shot 2014-01-04 at 12.44.03 pm.png
    Screen Shot 2014-01-04 at 12.44.03 pm.png
    4.5 KB · Views: 140
  • Screen Shot 2014-01-04 at 12.42.06 pm.png
    Screen Shot 2014-01-04 at 12.42.06 pm.png
    18.3 KB · Views: 145
Physics news on Phys.org
confusedatmath said:
Can someone explain the following:

How does changing the value of p/q affect the drawing of the graph (so domain/range/shape etc)
What makes this graph an odd function?
How to work out asymptotes?

Heres a picture so you know what I'm referring to:

View attachment 1825

And below is a question dealing with this type of function. Can someone please refer to the explanations on how to go about solving these questions.

View attachment 1824

Before to answering to Your question an important detail has to be specified: the cases You have proposed refer to an y=f(x) that is a real functions of real variable. If x, y or both are complex variables, then the answers are fully different...

Starting from the domain, what is the domain of an f(x)?... it is the set of real values of x for which y can effectively be computed...

Kind regards

$\chi$ $\sigma$
 
This is pretty straightforward, isn't it? You are told to use the graphs above as models (and they are clearly assuming real numbers). Looking at them you should see that the first and second have all real numbers as domain so the third must be the correct model: [tex]x^{\frac{3}{2}}[/tex] which is the same as [tex]\sqrt{x^3}[/tex].

So the answer is either (A) or (B). But the third graph has x= 0 as its left boundary, not x= a. That tells us that we must replace "x with some simple function of x.

Looking at (A) and (B) we see that must be either x- a or x+ a. Since x= a must correspond to "x= 0" in the model, which of those, x- a or x+ a, is 0 when x= a?