hannahg252
- 1
- 0
View attachment 3924
Hi,
I'm trying to prove something that I think is simple but am really struggling so would greatly appreciate any help!
Over 2 weeks I receive rebates, the value of the rebate can vary both due to the rebate on each case and also the number of cases ordered.
Between week 25 and week 26 my overall rebate per case dropped from £16.30 to £15.96 which has a financial impact of 13,566. I know this is the right number as it takes into account variation on rebate per case and the number of cases ordered but it is the same calculation in the individual ingredient rows above but they don't add up to this total.
Basically I want to prove how to split the 13,656 by ingredient to for example show that even though our rebate per case on soft drinks increased, because we have ordered 308 less cases this is causing our overall rebate per case to decline so that I can say how much of the 13,656 drop is driven by this.
The numbers are in the JPG file attached and would really value some clever brains to help me solve the riddle.
Thanks!
Hannah
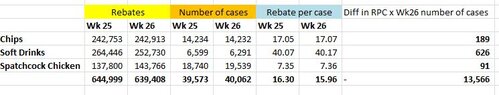