MHB How do I plot a distance-time graph using TikZ?

  • Thread starter Thread starter mathlearn
  • Start date Start date
  • Tags Tags
    Doubt Graph Time
AI Thread Summary
The discussion focuses on plotting a distance-time graph using TikZ while verifying speed calculations over specific time intervals. The user calculates average speeds for two segments: the first 6 seconds at 5 meters per second and the last 6 seconds at 10 meters per second, confirming that the latter is twice the former. The user seeks confirmation on the accuracy of their distance-time graph, which is affirmed by others in the thread. The TikZ code provided is noted as effective for creating the graph. Overall, the user successfully demonstrates their understanding of distance, time, and speed relationships in the context of graphing.
mathlearn
Messages
331
Reaction score
0
Problem

View attachment 6052

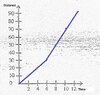
Plot the above given information in a Distance time graph.

View attachment 6051

View attachment 6050

Where do I need help

Hoping my graph is correct

Show that the speed in the final 6 seconds is twice the speed in first 6 seconds

But I'm having trouble here , I know $ distance=\frac{distance}{time} $

Many Thanks :)
 

Attachments

  • okay 1.jpg
    okay 1.jpg
    26.6 KB · Views: 101
  • okay 2.jpg
    okay 2.jpg
    32.5 KB · Views: 98
  • Capturedistance.PNG
    Capturedistance.PNG
    1.4 KB · Views: 118
Mathematics news on Phys.org
The average speed $\overline{v}$ over some time interval $\Delta t$ is given by the change in distance $d$ divided by the change in time.

So for the first 6 seconds (assuming the initial position is at 0), we have:

$$\overline{v}_1=\frac{\Delta d}{\Delta t}=\frac{30-0}{6-0}$$

And for the last 6 seconds, we have:

$$\overline{v}_2=\frac{\Delta d}{\Delta t}=\frac{90-30}{12-6}$$

Can you now show that $\overline{v}_2=2\overline{v}_1$?
 
MarkFL said:
The average speed $\overline{v}$ over some time interval $\Delta t$ is given by the change in distance $d$ divided by the change in time.

So for the first 6 seconds (assuming the initial position is at 0), we have:

$$\overline{v}_1=\frac{\Delta d}{\Delta t}=\frac{30-0}{6-0}$$

And for the last 6 seconds, we have:

$$\overline{v}_2=\frac{\Delta d}{\Delta t}=\frac{90-30}{12-6}$$

Can you now show that $\overline{v}_2=2\overline{v}_1$?

Thank you very much :)

First 6 seconds

$$\overline{v}_1=\frac{\Delta d}{\Delta t}=\frac{30-0}{6-0}$$

$$\overline{v}_1=\frac{30-0}{6-0}=\frac{30}{6}$$=5 meters per second

Last 6 seconds

$$\overline{v}_2=\frac{90-30}{12-6}=\frac{60}{6}=$$10 meters per second

Yes Now it is shown that first 6 second speed=2*last 6 second speed

Have I plot the distance time graph correctly? :)

Many Thanks :)
 
Yes, your plots look good to me. (Star)

Using our new TikZ feature:

\begin{tikzpicture}
%preamble \usepackage{pgfplots}
\begin{axis}
\addplot coordinates {(0,0) (2,10) (4,20) (6,30) (8,50) (10,70) (12,90)};
\end{axis}
\end{tikzpicture}
 
MarkFL said:
Yes, your plots look good to me. (Star)

Using our new TikZ feature:

\begin{tikzpicture}
%preamble \usepackage{pgfplots}
\begin{axis}
\addplot coordinates {(0,0) (2,10) (4,20) (6,30) (8,50) (10,70) (12,90)};
\end{axis}
\end{tikzpicture}

Thank you very much MarkFL ! (Happy) (Smile) (Party) , And that's when TIKz comes handy! :)
 
Seemingly by some mathematical coincidence, a hexagon of sides 2,2,7,7, 11, and 11 can be inscribed in a circle of radius 7. The other day I saw a math problem on line, which they said came from a Polish Olympiad, where you compute the length x of the 3rd side which is the same as the radius, so that the sides of length 2,x, and 11 are inscribed on the arc of a semi-circle. The law of cosines applied twice gives the answer for x of exactly 7, but the arithmetic is so complex that the...
Thread 'Imaginary Pythagoras'
I posted this in the Lame Math thread, but it's got me thinking. Is there any validity to this? Or is it really just a mathematical trick? Naively, I see that i2 + plus 12 does equal zero2. But does this have a meaning? I know one can treat the imaginary number line as just another axis like the reals, but does that mean this does represent a triangle in the complex plane with a hypotenuse of length zero? Ibix offered a rendering of the diagram using what I assume is matrix* notation...
Fermat's Last Theorem has long been one of the most famous mathematical problems, and is now one of the most famous theorems. It simply states that the equation $$ a^n+b^n=c^n $$ has no solutions with positive integers if ##n>2.## It was named after Pierre de Fermat (1607-1665). The problem itself stems from the book Arithmetica by Diophantus of Alexandria. It gained popularity because Fermat noted in his copy "Cubum autem in duos cubos, aut quadratoquadratum in duos quadratoquadratos, et...

Similar threads

Back
Top