How do you solve and plot inequalities with multiple variables?

  • Context: MHB 
  • Thread starter Thread starter ai93
  • Start date Start date
  • Tags Tags
    Graphs Inequalities
Click For Summary
SUMMARY

The discussion focuses on solving and plotting the inequalities \(2 PREREQUISITES

  • Understanding of compound inequalities
  • Basic graphing skills in the Cartesian plane
  • Knowledge of linear inequalities
  • Familiarity with shading regions on graphs
NEXT STEPS
  • Learn how to graph linear inequalities in two variables
  • Study the concept of feasible regions in linear programming
  • Explore the use of graphing software like Desmos for visualizing inequalities
  • Investigate the implications of strict versus non-strict inequalities in graphing
USEFUL FOR

Students, educators, and anyone interested in mastering the graphical representation of inequalities in mathematics.

ai93
Messages
54
Reaction score
0
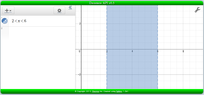
I have the inequalities $$2<x<6,\quad 1<y<5,\quad y-2\le2x, \quad-2y\ge8-4x$$ I have to solve these and plot it in a graph and show the region where they satisfy. I understand you have to find the common area and shade it.

How do you find the points to plot for $$2<x<6\quad and\quad 1<y<5$$

I think I have solved $$y-2\le2x\quad and -2y\ge8-4x$$ to $$y\le2x+2\quad and \quad y\le-4+2x$$ I am just unsure on the first two. Will making a X and Y table help to find the points?
 
Physics news on Phys.org
Well, the region $2<x<6$ contains all the points in the $x,y$-plane where the $x$-component lies between $2$ and $6$ (both not included).
 
Siron said:
Well, the region $2<x<6$ contains all the points in the $x,y$-plane where the $x$-component lies between $2$ and $6$ (both not included).

If i made a graph, would it go through the $y$ axis diagonal through the points $2$ and $6$?
 
mathsheadache said:
If i made a graph, would it go through the $y$ axis diagonal through the points $2$ and $6$?

For the inequality $2<x<6$, I would begin by graphing the lines $x=2$ and $x=6$ with dashed lines since the inequality is strict on both sides of $x$. Now you have divided the plane into 3 regions. which of these regions should you shade?
 
MarkFL said:
For the inequality $2<x<6$, I would begin by graphing the lines $x=2$ and $x=6$ with dashed lines since the inequality is strict on both sides of $x$. Now you have divided the plane into 3 regions. which of these regions should you shade?

Because it is x>2 is greater than, I shade everything to the right. And because x<6 is less than, shade everything to the left? I will be left with a shaded region in between 2 and 6?
 
mathsheadache said:
Because it is x>2 is greater than, I shade everything to the right. And because x<6 is less than, shade everything to the left? I will be left with a shaded region in between 2 and 6?

Yes, good! (Sun)

That's what $2<x<6$ means...any value of $x$ on the interval $(2,6)$, i.e., any value of $x$ in between 2 and 6, but not including 2 and 6. :D

So, the region you have shaded contains all the points in the plane for which the $x$-coordinate satisfies the given compound inequality.
 

Attachments

  • inequality.png
    inequality.png
    9.1 KB · Views: 115

Similar threads

  • · Replies 8 ·
Replies
8
Views
3K
  • · Replies 1 ·
Replies
1
Views
1K
  • · Replies 5 ·
Replies
5
Views
2K
  • · Replies 1 ·
Replies
1
Views
1K
  • · Replies 3 ·
Replies
3
Views
1K
  • · Replies 3 ·
Replies
3
Views
1K
  • · Replies 8 ·
Replies
8
Views
1K
  • · Replies 2 ·
Replies
2
Views
2K
Replies
2
Views
2K
  • · Replies 16 ·
Replies
16
Views
2K