How to Enhance 3D Parametric Plots in Mathematica?

  • Context: Mathematica 
  • Thread starter Thread starter Ishika_96_sparkles
  • Start date Start date
  • Tags Tags
    3d Parametric Plot
Join the discussion
Ask a follow-up here, or get your own question answered by working scientists, mathematicians and engineers — people, not an autocomplete.
Real named experts · corrections over time · the nuance an AI answer skips
4 replies · 3K views
Ishika_96_sparkles
Messages
57
Reaction score
22
TL;DR
I tried to make a superimposed plot of a curve on a half sphere and need help with some graphics.
This is the code line that i used to generate the following graphs

[CODE title="Mathematica Code lines"]ParametricPlot3D[{{1 + Cos[t], Sin[t],
2*Sin[t/2]}, {2 *Cos[t]*Sin[\[Phi]], 2*Sin[t]*Sin[\[Phi]],
2*Cos[\[Phi]]}}, {t, 0, 2 \[Pi]}, {\[Phi], 0, \[Pi]/2},
PlotStyle -> {Directive[Green, Thickness[0.025]], Yellow},
PlotRange -> All, PlotLegends -> {"Curve 1", "Sphere"},
BoxRatios -> {2, 2, 1}, Axes -> False, Background -> Gray,
Boxed -> False, Mesh -> 10][/CODE]

I obtained the following output
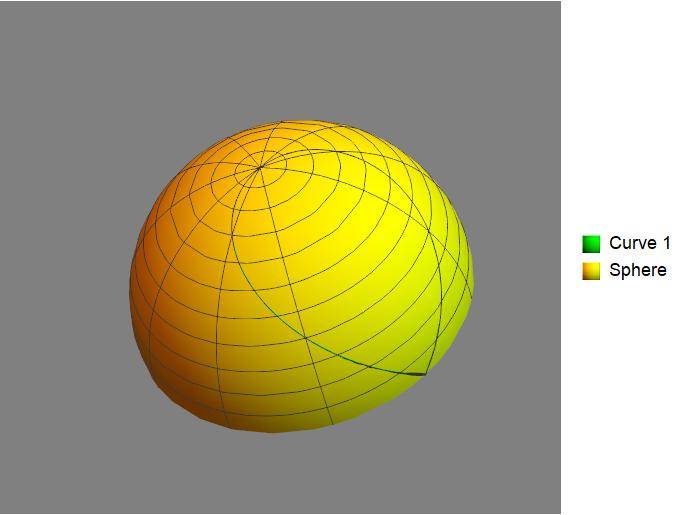
ParPlot3D.jpg


and with a slight change in the background
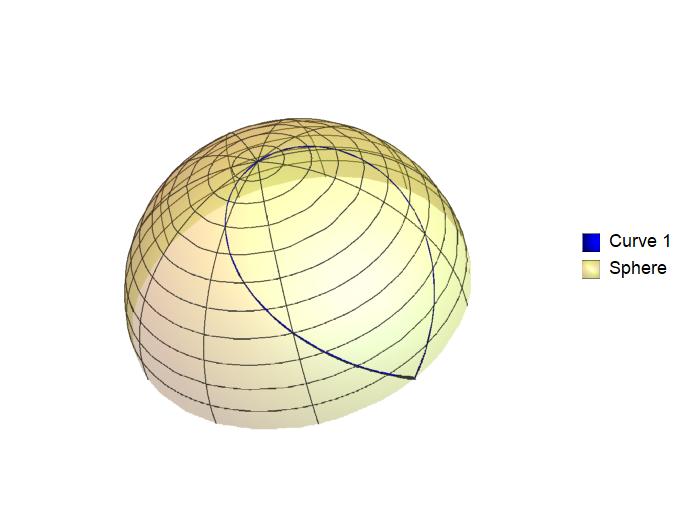
ParPlot3D2.jpg


Query:

I want to know if the visual of the general curve can be improved
and if one could put arrowheads along the Curve 1 in the anti-clockwise sense of rotation. What could be the procedure?

When I turn off the Mesh, the Curve 1 also vanishes. How could I keep the curve and put Mesh-> None at the same time?
 
on Phys.org
Ishika_96_sparkles said:
I want to know if the visual of the general curve can be improved
How?

Ishika_96_sparkles said:
and if one could put arrowheads along the Curve 1 in the anti-clockwise sense of rotation. What could be the procedure?
See https://mathematica.stackexchange.com/questions/127415/addding-arrows-in-closed-curves

Ishika_96_sparkles said:
When I turn off the Mesh, the Curve 1 also vanishes. How could I keep the curve and put Mesh-> None at the same time?
It works when I try it.
 
DrClaude said:

Thanks for the reply Dr Claude. I followed your link and tried to use it in my own code. I am able to get this
3Dplots.jpg
The improved visual of the graphic by using some built-in commands to label curves on the surface itself. For instance, the curve on the surface be labelled [itex]\alpha (t)[/itex] and is positioned along the curve somewhere.

About the Mesh-> None problem, i used Show[c1,s1] for the individual plots. Its solves now.

However, i still do not fully understand the technique of using the arrowheads. For example i use[CODE title="Mathematica Code lines"]c1=ParametricPlot3D[{1+Cos[t],Sin[t],2*Sin[t/2]},{t,0,pi/2}],
PlotStyle-> {Directive[Red,Thickness[0.005]],Arrowheads[{0,0.05,0.05,0.05,0}]},
PlotRange-> All,BoxRatios-> {2,2,1},Boxed-> True,Axes-> True]/.Line-> Arrow[/CODE]

I do not understand how the replacement works in this case! i.e. /.Line-> Arrow is linked to the list of arrowheads be placed on the curve c1. How? or should I have used /.c1-> Arrow?
 
Ishika_96_sparkles said:
[CODE title="Mathematica Code lines"]c1=ParametricPlot3D[{1+Cos[t],Sin[t],2*Sin[t/2]},{t,0,pi/2}],
PlotStyle-> {Directive[Red,Thickness[0.005]],Arrowheads[{0,0.05,0.05,0.05,0}]},
PlotRange-> All,BoxRatios-> {2,2,1},Boxed-> True,Axes-> True]/.Line-> Arrow[/CODE]
This can't be the exact code as the brackets aren't paired.

Ishika_96_sparkles said:
I do not understand how the replacement works in this case! i.e. /.Line-> Arrow is linked to the list of arrowheads be placed on the curve c1. How? or should I have used /.c1-> Arrow?
The former is the correct approach. Note however the use of :> instead of -> and the fact that it is Line[x_], not simply Line.
 
DrClaude said:
This can't be the exact code as the brackets aren't paired.

Yes, i had typed it out by hand. Sorry for the inconvenience.

Here is all the code pasted below

[CODE lang="matlab" title="Mathematica Code lines"]Clear[c1, s1]

c1 = ParametricPlot3D[{1 + Cos[t], Sin[t], 2*Sin[t/2]}, {t, 0,
2 \[Pi]},
PlotStyle -> {Directive[Red, Thickness[0.005]],
Arrowheads[{0, 0.05, 0.05, 0.05, 0}]}, PlotRange -> All,
BoxRatios -> {2, 2, 1}, Boxed -> True, Axes -> True] /.
Line -> Arrow;

s1 = ParametricPlot3D[{2 *Cos[t]*Sin[\[Phi]], 2*Sin[t]*Sin[\[Phi]],
2*Cos[\[Phi]]}, {t, 0, 2 \[Pi]}, {\[Phi], 0, \[Pi]/2},
PlotStyle ->
Directive[Yellow, Opacity[0.3], Specularity[White, 10]],
PlotRange -> All, BoxRatios -> {2, 2, 1}, Axes -> False,
Background -> White, Boxed -> False, Mesh -> None];

Show[{c1, s1}][/CODE]

Used the Arrow part in c1.