SUMMARY
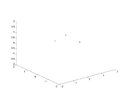
This discussion focuses on plotting single points in 3D space using MATLAB. The specific points to be plotted are (1,0,0), (0,1,0), and (0,0,1). The solution provided includes the MATLAB command plot3(1,0,0, '*',0,1,0,'*', 0,0,1,'*') along with axis limits set by zlim([-2 2]), ylim([-2 2]), and xlim([-2 2]). This method effectively visualizes the specified points in a 3D coordinate system.
PREREQUISITES
- Basic understanding of MATLAB syntax
- Familiarity with 3D plotting functions in MATLAB
- Knowledge of coordinate systems
- Experience with setting axis limits in MATLAB
NEXT STEPS
- Explore MATLAB's
plot3 function documentation for advanced plotting techniques
- Learn about customizing markers and colors in MATLAB plots
- Investigate 3D visualization tools available in MATLAB
- Study how to manipulate axis properties for better data representation in MATLAB
USEFUL FOR
This discussion is beneficial for MATLAB users, data visualizers, and engineers looking to enhance their skills in 3D plotting and visualization techniques.