\begin{figure}[!ht]
\centering
\begin{tikzpicture}[scale=.95]
   \draw[very thin,color=gray!35] (-5.5,-3.5) grid (5.5,3.5);
   \draw[<->] (-5.5,0) -- (5.5,0) node[right]{$x$};
   \draw[<->] (0,-4) -- (0,4) node[above]{$y$};
   \foreach\x in {-5,-4,-3,-2,-1,1,2,3,4,5}{
   \draw (\x,.1) -- (\x,-.1) node[below]{$\x$};
     }
   \foreach\x in {-3,-2,-1,1,2,3}{
   \draw (-.1,\x) -- (.1,\x) node[right]{$\x$};
     }
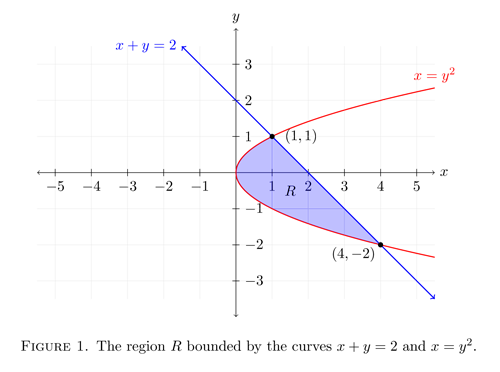
   \draw[<->,blue,thick](5.5,-3.5) -- (-1.5,3.5) node[above,left]{$x+y=2$};
   \fill.25] (1,1) -- (4,-2) -- plot[domain=0:4,smooth,samples=1500](\x,{-sqrt(\x)})
   -- plot[domain=0:1,smooth,samples=1500](\x,{sqrt(\x)}) --  cycle;
   \draw (1.5,-0.5) node{$R$};
   \draw[red,thick] plot[domain=0:5.5,smooth,samples=1500] (\x, {-sqrt(\x)});
   \draw[red,thick] plot[domain=0:5.5,smooth,samples=1500] (\x, {sqrt(\x)}) node[above]{$x=y^2$};
   \fill (1,1) circle (2pt) node[right=.2cm]{$(1,1)$};
   \fill (4,-2) circle (2pt) node[below=.25cm,left]{$(4,-2)$};
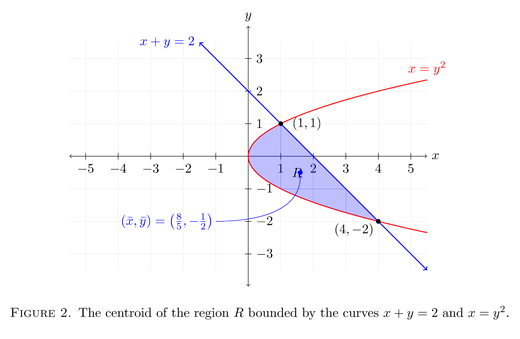
   \fill[blue] (1.6,-.5) circle (2pt);
   \draw[blue] (-2.5,-2)  node{$(\bar{x},\bar{y})=\left(\frac{8}{5},-\frac{1}{2}\right)$};
   \draw[->,color=blue] (-1,-2) to[out=0,in=270] (1.6,-.6);
\end{tikzpicture}
\caption{The centroid of the region $R$ bounded by the curves $x+y=2$ and $x=y^2$.}
\end{figure}