Measurements with the CsI(Tl) detector

Join the discussion
Ask a follow-up here, or get your own question answered by working scientists, mathematicians and engineers — people, not an autocomplete.
Real named experts · corrections over time · the nuance an AI answer skips
4 replies · 2K views
gxa
Messages
24
Reaction score
3
I made an experiment in the lab. I took some measurements with the CsI(Tl) detector by placing the cobalt at a distance of 5 cm. I have attached the measurement result. I need to find the count for the peak energies. How can I do it? Any idea?
 

Attachments

Physics news on Phys.org
You did not use the spectrometer efficiently. The counts are too spread out. You should reduce the conversion gain i.e., use fewer channels for the spectrum, and adust the pulse height gain to put the highest energy peak near the highest channel.

512 channels should be enough about 2keV per channel. If the resolution (Full Width at Half Mac) is 8% for example that would encompass about 40 channels.

With the spectra you have, you could bin (combine) about 8 consecutive channels to make your peaks stand out more. This would be like using only 512 channels.
 
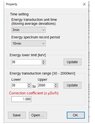
Thank you for your answer, the detector I use is a usb detector and I can only change these settings (I am sending it in the attachment)
 

Attachments

  • Capture.JPG
    Capture.JPG
    29.6 KB · Views: 221
Hello again,

1637171335020.png


You haven't been counting very long, have you ?
There is some similarity with e.g. the plot here
Co60.jpg


I hope your 'peaks' are only the ones at 1173 and 1332 keV ? The others are hard to distinguish and that means fitting will be hard too.

The general recipe is:
Form an expression for the assumed counting rate N(x) in a certain energy range, e.g. for two gaussian peaks on a quadratic background:$$N = ax^2 + bx + c \quad
+ C_1 \exp\left (- {(E_1-x)^2\over 2 \sigma_1^2}\right ) \quad +
C_2 \exp\left (- {(E_2-x)^2\over 2 \sigma_2^2}\right ) $$ and minimize ##\sum \Bigl (n_{observed}(x) - N_{expected}(x)\Bigr )^2## by varying the fit parameters ##(a,b,c,C_1, E_1,\sigma_1,C_2, E_2,\sigma_2)##

Figure below shows a half-hearted attempt with C1 =560, C2 = 480

1637174908267.png


but my hunch is you have software tools at your disposal that do this a whole lot better ...

And the binning together as @gleem proposes reduces the noise considerably

##\ ##
 
I'm only counting for 1 minute, thanks for your answers