Optimizing DSS stacking and post-processing for urban astrophotography

43 replies · 14K views · last reply
Science Advisor
Education Advisor
Insights Author
Messages
7,853
Reaction score
4,227
I created this thread because every online resource I have examined to date has been largely worthless- either totally over-engineered complexity or superficial garbage (can you tell I am irritated?). The problem is simple: optimize DSS image stacking and post processing based on quantitative image data. The essential metrics are 1) signal-to-noise ratio and 2) dynamic range.

Here’s the basic scenario: I am in a light-polluted urban environment. I image at low f-number, so fall-off (image non-uniformity) is a significant issue. My primary goal of image stacking (for me) is to completely remove the sky background across the entire field of view and to compress the dynamic range of the field of view to 'amplify' faint objects with respect to bright stars.

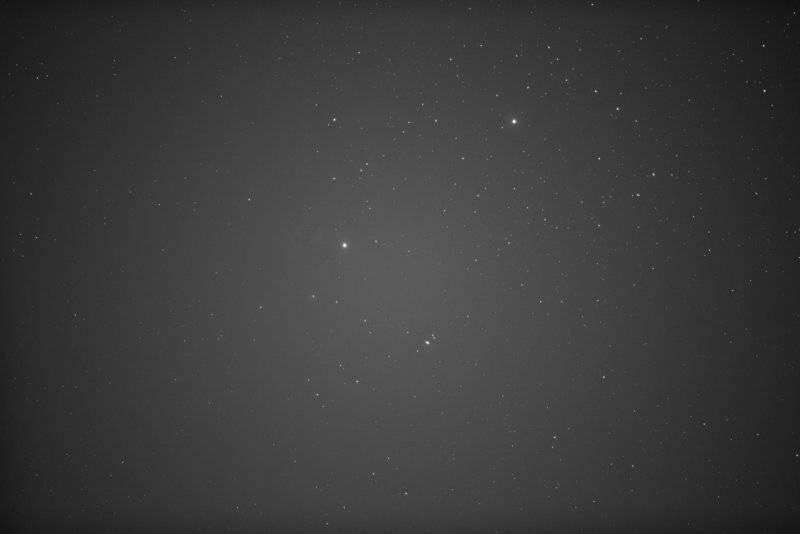
Let’s start with single frames- this already introduces potential confusion. I acquire frames in a 14-bit RAW format, but I have no way of directly accessing that data. So, for this thread, I used Nikon’s software to convert a single channel 14-bit RAW image into a 3-channel 16-bit TIF (RGB format). Most likely, this is done by averaging 4 neighboring same-color pixels in the RAW data to generate a single TIF pixel (14 bits + 2 bits = 16 bits). Here are two images, one taken at f/4 of the Pleiades, and the other taken at f/2.8 of the flame and horsehead nebulae:
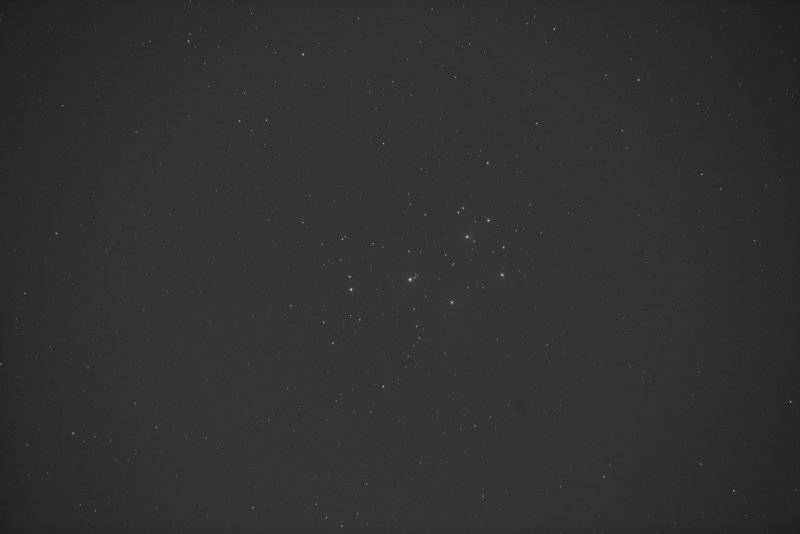
Single-frame astrophotograph of a star field with a loose open cluster of bright stars near the centre, on a grey sky background with visible light gradient.


Grayscale long-exposure star field with scattered stars, a few brighter ones visible, and a faint brightness gradient across the frame, with noticeable darkening toward the corners.


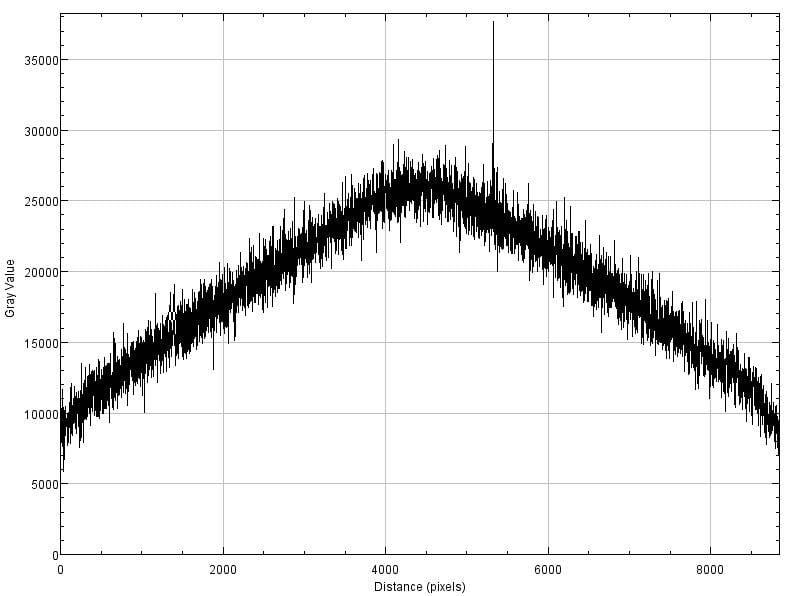
From these, I use ImageJ (now called Fiji) to extract quantitative data. First, I’ll provide a ‘linescan’ from the upper left corner to the lower right corner for each image. This graph returns the greyscale value at each pixel along the line:
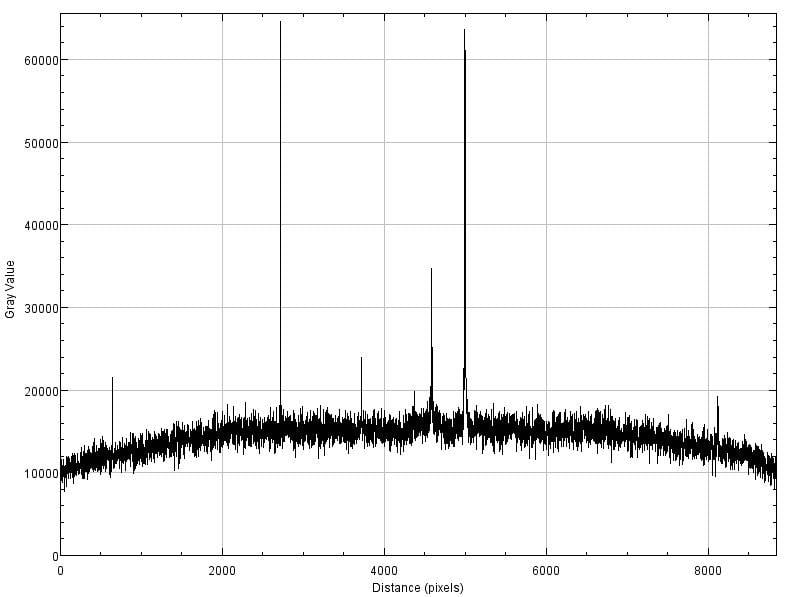
Line plot of gray value against distance in pixels across a single image row, showing a noisy baseline around 10000 to 17000 with several tall sharp spikes, the highest reaching about 64000.


Line plot of gray value against distance in pixels along a diagonal scan of an astrophotograph; gray value rises from about 9000 at the start to a peak near 26000 around 4500 pixels, then falls back, with a single sharp spike near 5300 pixels reaching about 37000.


There are three basic results here. First, as you can see, the falloff is especially significant at f/2.8. Second, you can see the effect of noise (both images were acquired at ISO 1000), and third, you can see tall spikes where the scan line happens to intersect a star.

Next, I can use ImageJ to determine a signal-to-noise ratio (SNR) by selecting a small star-fee region in the image and computing the greyscale mean and standard deviation; I measured this in the center of the frame and also near a corner of the frame (I apologize for the non-tabular formatting)

Image center: corner:
pleiades 15640 +/- 1317 13239 +/- 1203
horsehead 26004 +/- 1285 12721 +/- 1188

This brings up a question: I measured the SNR in terms of greyscale values, not in terms of bits or dB. I can convert the greyscale to dB easily enough, but what will make more sense is to think in terms of bit depth. I’m honestly not sure how to interpret my values in terms of that- it seems that I have about 11 bits of noise, so my 16-bit image has a dynamic range of only 5 bits (or 5 f-stops or 3.7 stellar magnitudes)? That doesn’t make sense. Help?

Here’s why I care about that question: dynamic range is what I need to maximize in order to separate faint objects from the sky background. Certainly, noise reduction is important, but as you will see, I also need to boost the dynamic range- and post-processing after stacking does this.

I’ll stop here for now: I’ve established some basic image metrics and determined them for 2 sample images. Moving forward, I have to rely on linescans to illustrate the process: there’s no point to posting the images.
 
Attachments
  • Single-frame astrophotograph of a star field with a loose open cluster of bright stars near the centre, on a grey sky background with visible light gradient.
    d2bdc0c7-446d-444e-a4f2-d623ff8b8fa5-original.jpg
    9.6 KB · Views: 1,200
  • Grayscale long-exposure star field with scattered stars, a few brighter ones visible, and a faint brightness gradient across the frame, with noticeable darkening toward the corners.
    1e1836d1-b494-49be-a368-461220bfac6d-original.jpg
    11.8 KB · Views: 1,103
  • Line plot of gray value against distance in pixels across a single image row, showing a noisy baseline around 10000 to 17000 with several tall sharp spikes, the highest reaching about 64000.
    d764577f-a7fc-4935-bcd9-5e37b4bd703f-original.jpg
    37.1 KB · Views: 1,218
  • Line plot of gray value against distance in pixels along a diagonal scan of an astrophotograph; gray value rises from about 9000 at the start to a peak near 26000 around 4500 pixels, then falls back, with a single sharp spike near 5300 pixels reaching about 37000.
    c859b4d2-db4b-40c5-be8f-f637f15c9a8b-original.jpg
    43.3 KB · Views: 1,173
  • Like
Likes   Reactions: DennisN, davenn and berkeman
Before we jump into the more complex things, do you take any calibration frames when imaging so you can correct for vignetting, dark current, sensor bias, etc?
 
  • Like
Likes   Reactions: russ_watters and davenn
Andy Resnick said:
This brings up a question: I measured the SNR in terms of greyscale values, not in terms of bits or dB. I can convert the greyscale to dB easily enough, but what will make more sense is to think in terms of bit depth. I’m honestly not sure how to interpret my values in terms of that- it seems that I have about 11 bits of noise, so my 16-bit image has a dynamic range of only 5 bits (or 5 f-stops or 3.7 stellar magnitudes)? That doesn’t make sense. Help?

Here’s why I care about that question: dynamic range is what I need to maximize in order to separate faint objects from the sky background. Certainly, noise reduction is important, but as you will see, I also need to boost the dynamic range- and post-processing after stacking does this.

Why is this important for what you want to do? Can you elaborate on what you mean when you say you want to optimize your image stacking and processing?
 
  • Like
Likes   Reactions: davenn
The linescans of the images seem to show both vignetting and COS2 light falloff. There isn't really enough data yet to pin it down. Bright-field Flat-field images at a few different f-stops and horizontal, vertical, and diagonal linescans of them would give a better chance of spotting what is happening.

A couple approaches come to mind though.
1) Use a sliding window along a line and subtract the local mean value of the window from each pixel. Actually what gets subtracted must be the mean value weighted by the window width. i.e. If the window is 8 pixels wide, 1/8 of the mean is subtracted each time the window is slid along the line. This is similar to edge enhancement in digital photography.

2) Based on inspection of image 2, the background brightness is radially symmetric with a slight curvature at either end. This curve shape is almost classical COS2 light falloff, with an added contribution. As speculation, that added contribution may be a mismatch between the scope aperture, image size and the camera optics. Being radially symmetric it could be modeled analytically and compensated that way.

Once you get the background flat, you can set a threshold below which all values are set to zero. This may make further processing easier and more effective. In audio processing this is the action of the Squelch control. In image processing, it is setting the black level.

In image processing, contrast modification, beyond just gain adjustment, is done by adjusting the Gamma of the image. This multiplies each intensity value by a factor proportional, or inversely proportional, to the pixels value.

Any or all of the above may be available in your current software.

Hope this helps.

Cheers,
Tom

EDIT: 1st paragraph
 
Last edited:
  • Like
Likes   Reactions: russ_watters
Drakkith said:
Why is this important for what you want to do? Can you elaborate on what you mean when you say you want to optimize your image stacking and processing?

Basically, I want to know simple things like: 1) how many images can I stack before hitting a point of diminishing return? 2) How can I achieve the highest dynamic range when I downsample the resultant 32-bit/channel image to a printable 8 bit/channel image? 3) How can I maintain consistent color rendition? 4) what is the faintest object I can reasonably expect to be able to image?
 
Tom.G said:
The linescans of the images seem to show both vignetting and COS2 light falloff. There isn't really enough data yet to pin it down. Bright-field Flat-field images at a few different f-stops and horizontal, vertical, and diagonal linescans of them would give a better chance of spotting what is happening.

A couple approaches come to mind though.
<snip>

Hope this helps.

Cheers,
Tom

Thanks, and I agree these are all important aspects to track, but mostly they miss the point. Fall-off happens, how can I best compensate? As I will show, the flat-field accuracy requirement (flat field as compared to bright field) is highly stringent and currently beyond my ability to fully achieve. Even worse, the sky background varies from day to day and is not spatially constant. The background brightness is often not exactly radially symmetric- city lights introduce an asymmetry, and this problem becomes worse when using wider-angle lenses -even at 105mm, the falloff is very asymmetric, see here:

Line graph of gray value against distance in pixels across an image row, showing a smooth arc from about 9000 at the left edge up to about 21000 near the middle and back down to about 14000 at the right, with several sharp upward spikes representing bright stars.


Most of your other points relate to post-processing of the stacked image. Local background subtraction, adjusting gamma, setting black and white points, etc. happens after stacking. However, the major problem I have yet to solve with post-processing is posterization... stay tuned!
 
Attachments
  • Line graph of gray value against distance in pixels across an image row, showing a smooth arc from about 9000 at the left edge up to about 21000 near the middle and back down to about 14000 at the right, with several sharp upward spikes representing bright stars.
    8d093fec-90ce-4faf-b8c5-08cdb47deb36-original.jpg
    28.2 KB · Views: 1,150
Drakkith said:
Before we jump into the more complex things, do you take any calibration frames when imaging so you can correct for vignetting, dark current, sensor bias, etc?

I do flat-field correction for the fall-off, but nothing else. Honestly, I don't see how including dark and bias frames will result in a significant improvement (yet).
 
Andy, can you send me one of your raw images? I'd like to try something in my image processing software. PM me.
 
Andy Resnick said:
Local background subtraction, adjusting gamma, setting black and white points, etc. happens after stacking.
My intent was to do the local background subtraction on the individual frames BEFORE stacking. That makes a much wider dynamic range possible and will decrease the tendency for posterization you are plagued with.
Andy Resnick said:
I do flat-field correction for the fall-off, but nothing else. Honestly, I don't see how including dark and bias frames will result in a significant improvement (yet).
With the huge spatial background variation you are seeing, dark and bias frames are pointless. The background variation completely swamps those effects.

Cheers,
Tom

p.s. I see @Drakkith made an offer while I was typing.
Drakkith, when/if you do some processing on Andy's image, could you post at least the before and after images?
 
Tom.G said:
My intent was to do the local background subtraction on the individual frames BEFORE stacking. That makes a much wider dynamic range possible and will decrease the tendency for posterization you are plagued with.

I am hesitant to do this due to the number of images, but I could try a test run on a dozen images and see what happens-thanks for the suggestion!
 
Tom.G said:
My intent was to do the local background subtraction on the individual frames BEFORE stacking. That makes a much wider dynamic range possible and will decrease the tendency for posterization you are plagued with

How does that create a wider dynamic range?

Tom.G said:
With the huge spatial background variation you are seeing, dark and bias frames are pointless. The background variation completely swamps those effects.

I disagree. I think dark and flat frames should always be taken and subtracted. Otherwise you can't accurately identify the background. Besides, dust donuts are even more prominent on images with bright backgrounds, and flat subtraction removes these.

Tom.G said:
Drakkith, when/if you do some processing on Andy's image, could you post at least the before and after images?

Certainly.
 
  • Like
Likes   Reactions: russ_watters and davenn
Part 2: stacking.

Thanks for the comments and ideas, hopefully this post will start to clarify some of the technical problems. Recall, I am very much interesting in learning how to quantify images (SNR, dynamic range) in terms of bit depth, and this post should demonstrate why.

Stacking in DSS results in 32-bit/channel images, so I need to identify a few key concepts. Perhaps the most important is a ‘tone mapping curve’ that maps input grey values to output grey values. Tone mapping does not have to be linear, and I will show that the curve should have a specific shape (‘filmic tone mapping’ or ‘Reinhard tone mapping’) that is highly nonlinear.

I typically stack about 200 14-bit RAW images at a time, that seems to be the (empirical) point of diminishing returns. Averaging 200 14-bit frames results in a 14+ 8 = 22 bit image which is ‘somehow’ embedded into a 32-bit image. Since the black and white values are fixed, the best (IMO) way to think about the image is in terms of the image histogram and how many bins/buckets are available:

8-bit image: 255 buckets
14-bit RAW: 16384 'buckets'
16-bit TIF: average of 4 pixels, 65536 'buckets'
32-bit TIF: 4294967296 'buckets'
average 200 14-bit RAW = 22 bit image = 4194304 'buckets'

This is the origin of the next problem I encounter: 4194304 buckets are dispersed into 4294967296 slots, resulting in a sparse image histogram. DSS then allows me to downsample and save the 32-bit image to 16-bits, which is what I need for post-processing.

Let’s look at what happens, starting with the f/4 Pleiades image, since flat-field correction isn’t required. The tone map curve has a horizontal (input) axis and vertical (output) axis, and DSS allows a lot of different ways to apply a tone map. First, I’ll show the most simple tone map: linear-linear, where both axes are linear scales. Here’s the resultant linescan, when the horizontal axis has 4294967296 bins and the vertical axis has 4194304 bins:

Line graph of gray value against distance in pixels, with a flat band near 7500 that rises to about 7900 in the middle, and a few sharp spikes.


The predominant feature is ‘posterization’: not every 16-bit grey value occurs in the downsampled image because most of the input 32-bit buckets are empty. So, although I would expect the background level to be a smooth curve, there are instead discrete values present. As expected, the SNR is greatly decreased: the grey level statistics are:

center: corner:
7887+/- 14 7476 +/- 3

The noise level has decreased from 11 bits to 3 or 4 bits, in agreement with the number of images averaged together. But more problematic, the dynamic range of the image has also decreased! Look at the height of the ‘star spike’ as compared to the background level- it’s much lower as compared to the single RAW image. What this means is that using this tone map, there’s no way I can extract out the nebula features, faint stars, or anything that is ‘slightly above’ the background level.

So instead, I use a different tone map- the ‘filmic’ tone map. I also use an alternate horizontal axis, ‘log-root’ scaling, so that the background is located more in the midrange tones than the dark tones, which is what happens for linear scaling. Using that tone map, look at the linescan:

Line graph of gray value against distance in pixels, from 0 to about 8800. The curve rises from about 7500 at the left edge to a broad peak near 18000 around pixel 5000, then falls back to about 8000 at the right edge. Several sharp vertical spikes rise above the curve, the tallest near pixel 2600 reaching about 51000.


The posterization is less pronounced, but the noise is also higher (still less than in individual frames):

center: corner:
18088 +/- 458 8505 +/- 148

I have also increased the dynamic range- I have assigned more ‘buckets’ in the neighborhood of the background level, ‘stretching’ the image contrast at midrange tones and allowing me (in post-processing) to separate the nebula from the background. You can see this in the number of 'star spikes' that are simply not present in the linear-linear linescan. Another side effect from this tone map is that stars get larger- sometimes considerably so. It’s also true that I have ‘amplified’ the falloff, so perhaps flat field correction would be helpful here. But this is next tricky bit: accurate flat field correction. I’ll cover that next.

So, at this point in the process, I am stuck with a highly posterized image. There may be hope that when I downsample again to 8 bits/channel this can be removed, but to date I have been unsuccessful. The posterization also causes problems with color consistency. Maybe some of you have better tone mapping strategies, let me know!

But all is not lost- what I learned to do was to treat each 200-image stack as a ‘substack’; stacking together 4 or 5 16-bit tone mapped substacks decreases the amount of posterization present.
 
Attachments
  • Line graph of gray value against distance in pixels, with a flat band near 7500 that rises to about 7900 in the middle, and a few sharp spikes.
    e2fa0983-a67a-40df-8a6c-b82358cbffc7-original.jpg
    21.2 KB · Views: 978
  • Line graph of gray value against distance in pixels, from 0 to about 8800. The curve rises from about 7500 at the left edge to a broad peak near 18000 around pixel 5000, then falls back to about 8000 at the right edge. Several sharp vertical spikes rise above the curve, the tallest near pixel 2600 reaching about 51000.
    ecca1142-9808-43af-956b-24635bbf4c77-original.jpg
    29.3 KB · Views: 1,041
Drakkith said:
Before we jump into the more complex things, do you take any calibration frames when imaging so you can correct for vignetting, dark current, sensor bias, etc?

Andy Resnick said:
Basically, I want to know simple things like: 1) how many images can I stack before hitting a point of diminishing return? 2) How can I achieve the highest dynamic range when I downsample the resultant 32-bit/channel image to a printable 8 bit/channel image? 3) How can I maintain consistent color rendition? 4) what is the faintest object I can reasonably expect to be able to image?

Andy Resnick said:
I do flat-field correction for the fall-off, but nothing else. Honestly, I don't see how including dark and bias frames will result in a significant improvement (yet).

and how are you doing that ?

Your images and graphs would indicate that you are not doing dark or flat frames or if you are, you are not doing them correctly
Because if your were doing them correctly then you wouldn't see that huge variation in background brightness across those images
Brighter centres of the images is a sure sign of a lack of flat and dark frames, the frames would have a flatter brightness across the entire frame

Your other big issue of signal to noise level is because of your very short exposure times ... I think you stated 8 sec in the other thread

There is NO SUBSTITUTE for longer exposures when it comes to SNR ... by default, it automatically produces better SNR
Many 8 sec exposures will never produce the SNR that a single 5 minute exposure will produce

My 30 sec exposures do better than your 8 sec but mine would still vastly improve with exposures of 1 minute or more for each stacked frame
Andy Resnick said:
Basically, I want to know simple things like: 1) how many images can I stack before
hitting a point of diminishing return?

As much as I hate the statement "I have seen" I need to use it as I don't have the time to scour through dozens of posts on a
number of different forums... anywhere from 30 - 70 frames would be in the range of common ... so let's avg that and say
50 frames stacked. ( I will try and find some references).
Now, again, that will also depend somewhat on your exposure times.
1.5 hrs (90 mins) of 5 minute exposures ( 18 exposures) is going to provide a vastly superior image compared to 1.5hrs
of 8 sec exposures (675 exposures) again because of the better SNR that 5 min exposures will provide, even tho the total time is the same.

a good example ...

my 20 lights, 9 darks, no flats
Long-exposure deep-sky photo of the Eta Carinae Nebula: glowing pink and red gas clouds with a bright white central star cluster, set against a dense field of stars. Caption reads Eta Carina Nebula 4 Jan. 2019, 10 minutes exp.; 20 x 30 sec, Canon 6D, EF 100-400mm L at 400mm, f/5.6, 2500 ISO.


my mate's 156 x 40 sec lights 16 darks

Long-exposure photo of a star field with a glowing pink and purple emission nebula in the center, surrounded by dense stars and faint reddish dust lanes.
Did that extra ~ 130 light frames produce a better image ? ... honestly, I don't think so :frown:I would, quite safely, state that I doubt that 99.9% of astrophotographers would even contemplate most of what you have
commented on in your first post ... I, for sure, don't :wink:

Why do you think I make the effort to load all my kit into the car and head to a darker site ? :smile:

If you or I really want to do serious imaging from home, deep in the sky glow of suburbia, the ONLY way to do it is to use
narrow band filtering ... Ha, OIII, Astronomik CLS Filter etc ... you can then produce awesome images even during a,
close to your target, full moon ...just some examples, you can read up further ...

Astronomik CLS Filter
https://www.astronomik.com/en/visual-filters/cls-filter.html

IDAS P2 LPS filter
https://www.sciencecenter.net/hutech/idas/lps.htm

Astronomik H-Alpha 12nm CCD Filter - Canon EOS APS Clip
https://optcorp.com/products/astronomik-h-alpha-12nm-ccd-filter-canon-eos-aps-clipBasically, if you want to do imaging from within a light polluted location, you really have no choice but to use filters
Then you can up your exposure times ( assuming your mount is a good tracking mount and well polar aligned ??)
Otherwise you are just asking DSS or other stacker and post processing program to do things it cannot do
Dave
 
Attachments
  • Long-exposure deep-sky photo of the Eta Carinae Nebula: glowing pink and red gas clouds with a bright white central star cluster, set against a dense field of stars. Caption reads Eta Carina Nebula 4 Jan. 2019, 10 minutes exp.; 20 x 30 sec, Canon 6D, EF 100-400mm L at 400mm, f/5.6, 2500 ISO.
    ETA CARINA 20Lw9D 400mm Sequator1sm.jpg
    134.4 KB · Views: 1,029
  • Long-exposure photo of a star field with a glowing pink and purple emission nebula in the center, surrounded by dense stars and faint reddish dust lanes.
    eta carina - MichaelM.jpg
    120.7 KB · Views: 1,006
  • Like
Likes   Reactions: russ_watters
davenn said:
There is NO SUBSTITUTE for longer exposures when it comes to SNR ... by default, it automatically produces better SNR
Many 8 sec exposures will never produce the SNR that a single 5 minute exposure will produce

I disagree. The total exposure time with 8 sec frames will need to be higher, but you should have little trouble getting equal and better SNR with enough 8 sec frames.

davenn said:
Did that extra ~ 130 light frames produce a better image ? ... honestly, I don't think so :frown:

Perhaps I'm misreading something. Were your images taken with twenty 30 sec frames? If so, your mate's picture must have been taken in heavily light polluted skies or something, as he has more frames at longer exposure times. His image should look at least as good as yours, if not substantially better.
 
And speaking of DSS

I have almost deleted it off my computer, as I have been getting more and more frustrated with its refusal to align a bunch of frames
because it thinks there are not enough stars to do the alignment with.

I have started using Sequator
https://sites.google.com/site/sequatorglobal/

It's so easy to use
 
Drakkith said:
How does that create a wider dynamic range?
In light of the OPs later post it doesn't. The posted image lost 70% of the dynamic range to background, and I was assuming the whole processing chain used the same number of bits... and I probably should have said the available dynamic range.

Drakkith said:
I disagree. I think dark and flat frames should always be taken and subtracted. Otherwise you can't accurately identify the background. Besides, dust donuts are even more prominent on images with bright backgrounds, and flat subtraction removes these.
OK, I'll go along with that. I was apparently over-simplifying in trying to get rid of the gross errors first! :frown:
 
Drakkith said:
disagree. The total exposure time with 8 sec frames will need to be higher, but you should have little trouble getting equal and better SNR with enough 8 sec frames.

no, I have seen the opposite so often ... I can't express the results mathematically etc ... just the physical results
I have never seen where multiple very short exposures, say Andy's 8 sec exp, will equal a longer single exp.
The longer single exp. will always produce a better SNR
Drakkith said:
Perhaps I'm misreading something. Were your images taken with twenty 30 sec frames? If so, your mate's picture must have been taken in heavily light polluted skies or something, as he has more frames at longer exposure times. His image should look at least as good as yours, if not substantially better.
we were at the same site :smile:

This is what I was saying in that post ..... there is a point where extra exposures don't add to the image. which is what I was addressing in Andy's Q

I see in a later post of his he is talking of 200 exposures stacked. Honestly I think that is a waste of time
 
The two images @davenn posted look like they were processed with different Gamma and Black level threshold, with the second image having both settings at a higher level.
 
Tom.G said:
The two images @davenn posted look like they were processed with different Gamma and Black level threshold, with the second image having both settings at a higher level.
possibly :smile:

I may ask him for 20 of his frames and process them myself in the same way I did with mine
It would be interesting to them see any differences
 
  • Like
Likes   Reactions: Tom.G
davenn said:
no, I have seen the opposite so often ... I can't express the results mathematically etc ... just the physical results
I have never seen where multiple very short exposures, say Andy's 8 sec exp, will equal a longer single exp

So you're saying no amount of 5 second exposures will equal or beat a single 10 second exposure? I can say with quite a bit of confidence that this isn't true, as I've stacked many short exposures before. The problem with short exposures compared to longer exposures is that the noise from the sensor (and perhaps a few other electronic sources) during readout is the same regardless of the length of the exposure. If this noise is a significant portion of the total noise, then you're trying to 'beat the noise down' with stacking, which is subject to a non-linear effect (namely that doubling the SNR, equivalent to halving the noise, requires quadrupling the number of exposures). But with longer exposures, this source of noise is much less significant. I can show a bit of math if you'd like.

davenn said:
we were at the same site :smile:

Then there must be a big difference in gear, optics, processing, or something. With more frames and longer exposures his image should be much, much better.
 
  • Like
Likes   Reactions: Tom.G
@Andy Resnick one thing I just noticed was that you seem to be comparing the noise of the two processed images in post #12. I think this is problematic. The tone mapping process appears to alter the values of the pixels themselves (except the linear tone mapping), so trying to determine the noise from looking at their values doesn't seem right to me. Any noise measurements should be done on the raw images before/after calibration and stacking, but before any other processing is done. If you have to use tone mapping when stacking, then I'd suggest only making noise measurements on the linear mapping.

Andy Resnick said:
Let’s look at what happens, starting with the f/4 Pleiades image, since flat-field correction isn’t required. The tone map curve has a horizontal (input) axis and vertical (output) axis, and DSS allows a lot of different ways to apply a tone map. First, I’ll show the most simple tone map: linear-linear, where both axes are linear scales. Here’s the resultant linescan, when the horizontal axis has 4294967296 bins and the vertical axis has 4194304 bins:

Your first linescan is very confusing. There appears to be two 'floors' in the pixel values, creating a plateau-like shape on the linescan. I would expect a linear mapping to preserve the pixel values a lot better. Do you know more about what this tone mapping is doing? Does the conversion between 14, 16, 22, and 32 bit images appropriately scale your pixel values to preserve the dynamic range?
 
  • Like
Likes   Reactions: Tom.G
davenn said:
<snip>

I would, quite safely, state that I doubt that 99.9% of astrophotographers would even contemplate most of what you have
commented on in your first post ... I, for sure, don't :wink:

Sheesh- tell me how you really feel :)

davenn said:
Why do you think I make the effort to load all my kit into the car and head to a darker site ? :smile:

If you or I really want to do serious imaging from home, deep in the sky glow of suburbia, the ONLY way to do it is to use
narrow band filtering ...

And maybe that is really the only answer here- maybe I have indeed hit the limit of what I can do. Even so, I think it's reasonable to determine if 'going pro' is indeed the only solution, since that fundamentally changes what I am doing. Right now, I can set up and start to acquire images within 10 minutes of deciding to go outside (and that includes polar aligning), and when I am done everything is put away and I am in bed within 15 minutes. That is to say, right now doing astrophotography is easy and relaxing. I hesitate to make it a giant production- there's a silver-tier dark-sky park about a hour's drive from me, making use of that greatly increases my level of pain- right now, the computer is doing most of the work.

davenn said:
Basically, if you want to do imaging from within a light polluted location, you really have no choice but to use filters
Then you can up your exposure times ( assuming your mount is a good tracking mount and well polar aligned ??)
Otherwise you are just asking DSS or other stacker and post processing program to do things it cannot do

I'm not sure the problem is DSS per se- I think if I can control/eliminate posterization and figure out flat field correction better, I'll be happy.
 
Drakkith said:
@Andy Resnick Your first linescan is very confusing. There appears to be two 'floors' in the pixel values, creating a plateau-like shape on the linescan. I would expect a linear mapping to preserve the pixel values a lot better. Do you know more about what this tone mapping is doing? Does the conversion between 14, 16, 22, and 32 bit images appropriately scale your pixel values to preserve the dynamic range?

If I understand your question, you are referring to what I am calling posterization, or maybe quantization error, and I agree, I expected the mapping to 'not do this'. I believe (and this is just my unfounded idea) that the features you describe arise from converting the 32-bit image to a 16-bit image. But this is a guess. In any case, what you are describing is the 'fundamental problem' in my image reconstruction process, and I can't quite figure out how to get around it.
 
Part 3: flat field correction.

Now that I’ve outlined the stacking process, let’s look at why flat field correction helps. For this, I’ll use the 400/2.8 set of images (horsehead nebula). Here’s a set of linescans of tone mapped downsampled images without flatfield correction, the first one is a linear input scale and linear tone map, the second a log-root input scale and linear tone map, and lastly the log-root Reinhardt tone map:

Line graph of Gray Value against Distance (pixels) along a scan, showing stepped plateaus rising toward the centre, with a sharp spike near pixel 4500 and a smaller spike near 8300.


Line graph of gray value against distance in pixels, showing a stepped background profile that rises from about 24000 at the edges to about 28000 near the centre, with two sharp spikes near 4500 and 8300 pixels.


Line graph of gray value against distance in pixels, showing a broad peak near 4400 pixels rising to about 33000, with several sharp narrow spikes up to roughly 61000, and a steadily sloping baseline from about 4000 to 4000 gray value at the edges.


The posterization/quantization error is obvious, and the effect of various tone maps should be clear. Again, both the dynamic range and noise levels are highest for the nonlinear tone map, but this may not be obvious given the large nonuniform background level. To fix the nonuniform background, DSS allows the use of ‘flats’, which are star-free images that are used to make the background level spatially uniform. Ideally, this step results in a flat background.

I say ‘ideally’, because the degree of exactness required to fully flatten the background has, so far, been beyond my ability. There are hints and tips everywhere about how to obtain ‘good’ flats, none of those really worked for me. Flat field correction gets easier the higher the f-number is and low f-number imaging is far more difficult to correct. In the end, I took a series of flats at varying f-number by imaging a white LCD display, and then made combinations of various flats, so that in the end, I have about 6 different flats that I can try when imaging at 400/2.8 (in total, I have about 30 flats for 5 or 6 imaging configurations). Selection of a particular flat is largely trial-and-error, and I have none that attempt to correct nonaxisymmetric background levels.

Here is what the flat-field corrected 32-bit stacked image histogram looks like in DSS: nothing at all like what you will find online:

Line plot with a nearly straight dotted black line rising from lower left to upper right, and a set of narrow colored peaks near the horizontal center that rise to the top edge of the frame.


Here are example linescans of the impact of a ‘first guess’ flat on the 16-bit downsampled stacked images, presented in the same order as above:

Line scan plot of gray value against distance in pixels, showing a mostly flat baseline near 8400 with dense dips to about 7900 between roughly 2100 and 6500 pixels and two sharp spikes near 4500 and 8300 pixels.


Line scan plot of gray value against distance in pixels, showing a flat background near 26,500 with a few sharp spikes, one reaching about 35,000 near pixel 4,500 and another near 32,000 near pixel 8,300.


Line plot of Gray Value against Distance (pixels) across an image, showing a broad arc from about 23000 at the left edge up to about 32000, down to about 18000 near the middle, and back up to about 33000 at the right; sharp spikes rise to around 58000 near pixel 4500 and 57000 near pixel 8350.


The first two scans appear to show near complete correction, however the extreme tone stretching that occurs with a Reinhardt tone map shows that the residual background is not sufficiently uniform. In fact, the shape of the residual background indicates that the selected flat over-corrected the brightfield images. From doing this for a year, my experience tells me what the next-guess flat should be, with the following result:

Linescan graph of gray value against distance in pixels across an astrophotograph, showing a broad nonuniform background that rises to peaks near 600 and 8,500 pixels, with sharp bright spikes between about 4,200 and 8,400 pixels.


This is clearly a significant improvement. But for perspective, let’s look at the actual differences in those two flat images- I computed the (16-bit valued) difference between the two different flats and here’s the linescan through the resultant:

Line plot of gray value against distance in pixels, showing a noisy, roughly bell-shaped profile that rises from near 0 to a peak of about 60 near 4500 pixels and falls back to near 0 by 8500 pixels.


Look at the vertical scale- at most, the difference is about 55 grey values out of 65535, a difference of 0.08%. Out in the wings, where most of the improvement occurred, the difference is closer to 0.01%. That’s just crazy, IMO, and demonstrates how nonlinear my tone mapping really is.

The residual non-flat background creates problems when subtracting the background in post-processing, which is my next step. As I will show, if the posterization/quantization problem is fixed, there will be a large improvement in my ability to subtract the background.
 
Attachments
  • Line graph of gray value against distance in pixels, showing a stepped background profile that rises from about 24000 at the edges to about 28000 near the centre, with two sharp spikes near 4500 and 8300 pixels.
    bd94b538-96da-4980-9c06-1cfc4acdad2d-original.jpg
    23 KB · Views: 647
  • Line graph of Gray Value against Distance (pixels) along a scan, showing stepped plateaus rising toward the centre, with a sharp spike near pixel 4500 and a smaller spike near 8300.
    21e8c19f-9f8c-418f-a965-c1afa4c9a831-original.jpg
    23.9 KB · Views: 678
  • Line graph of gray value against distance in pixels, showing a broad peak near 4400 pixels rising to about 33000, with several sharp narrow spikes up to roughly 61000, and a steadily sloping baseline from about 4000 to 4000 gray value at the edges.
    7bffad00-9829-4a84-bf16-2caf8a7a7009-original.jpg
    27.9 KB · Views: 718
  • Line scan plot of gray value against distance in pixels, showing a mostly flat baseline near 8400 with dense dips to about 7900 between roughly 2100 and 6500 pixels and two sharp spikes near 4500 and 8300 pixels.
    9b7f544b-4cab-4302-b6fb-af0a0a70b845-original.jpg
    23.9 KB · Views: 689
  • Line scan plot of gray value against distance in pixels, showing a flat background near 26,500 with a few sharp spikes, one reaching about 35,000 near pixel 4,500 and another near 32,000 near pixel 8,300.
    0452490d-b4a8-45de-b89f-7df59ec1274f-original.jpg
    22.1 KB · Views: 647
  • Line plot of Gray Value against Distance (pixels) across an image, showing a broad arc from about 23000 at the left edge up to about 32000, down to about 18000 near the middle, and back up to about 33000 at the right; sharp spikes rise to around 58000 near pixel 4500 and 57000 near pixel 8350.
    898d5ce4-94c0-4348-acbb-b051eed1c07a-original.jpg
    31.6 KB · Views: 657
  • Linescan graph of gray value against distance in pixels across an astrophotograph, showing a broad nonuniform background that rises to peaks near 600 and 8,500 pixels, with sharp bright spikes between about 4,200 and 8,400 pixels.
    df4ce46f-b3db-45e3-ac61-5cd536918c67-original.jpg
    30 KB · Views: 642
  • Line plot of gray value against distance in pixels, showing a noisy, roughly bell-shaped profile that rises from near 0 to a peak of about 60 near 4500 pixels and falls back to near 0 by 8500 pixels.
    d363c56a-8149-4fe5-bc5b-6e8b81781739-original.jpg
    43.4 KB · Views: 715
  • Line plot with a nearly straight dotted black line rising from lower left to upper right, and a set of narrow colored peaks near the horizontal center that rise to the top edge of the frame.
    65dce22a-fb53-40e0-ba11-e17bfcaf001d-original.jpg
    11.6 KB · Views: 593
Last edited:
Flats are not designed to correct for the asymmetric skyglow you get when imaging near urban areas, and I don't recommend trying to adapt them to do so. Flats should only be used to correct for vignetting, dust on the optics, and variations in your sensor's response over its pixel field.

On my phone right now, so I can't go into more detail at this time.
 
  • Like
Likes   Reactions: russ_watters
@Andy Resnick unfortunately my processing software crashes when I attempt to load your photo. It's an old program, so it doesn't really surprise me. I can't even get it to run on a newer PC. My idea was to try what's known in my software as a median rank process to extract the large scale structure from the image (the skyglow) and then subtract it from the original image.
 
@Andy Resnick For background subtraction can you take a grossly out-of-focus image of your target and then subtract that from a "good," in-focus image? You may have to play with the amplitude scaling of the two images for best cancellation.

Cheers,
Tom
 
Tom.G said:
@Andy Resnick For background subtraction can you take a grossly out-of-focus image of your target and then subtract that from a "good," in-focus image? You may have to play with the amplitude scaling of the two images for best cancellation.

Cheers,
Tom

If there are only stars in the images, this can work well. However, when there are extended nebula/dust cloud features that are of the same approximate size as the background gradient, this doesn't work well. I should be able to show this shortly.
 
Last edited:
Drakkith said:
@Andy Resnick unfortunately my processing software crashes when I attempt to load your photo. It's an old program, so it doesn't really surprise me. I can't even get it to run on a newer PC. My idea was to try what's known in my software as a median rank process to extract the large scale structure from the image (the skyglow) and then subtract it from the original image.

Yep...
 
Update:
Tom.G's suggestion about using 16-bit brights proved useful; I don't have the linescans to show this, but based on the results, there is evidence that DSS wasn't handling the RAW images correctly. There are some RAW settings in DSS I can play with- stacking the 16-bit images invalidated the flat frames- but I'm hoping to show some dramatic improvement within a few days.

Progress?