Plotting IV curve points for silicon diode IN4001 forward and reverse bias

8 replies · 2K views · last reply
Avanthica
Messages
14
Reaction score
1
Homework Statement
draw the graph between the voltage and the current and hence find the dynamic resistance of the diode for both forward and reverse bias condition.
Relevant Equations
∆𝑅=∆𝑉/∆𝐼
how to plot these points in the same graph and find the foward biasand reverse bias dynamic resistance for the SILICONE DIODE IN4001
FORWARD BIAS REVERSE BIAS
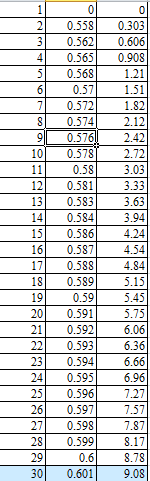
Spreadsheet with two columns of numbers in rows 1 to 30: the first column holds voltages from 0 to 0.601 V and the second holds current values from 0 to 9.08 in increasing order, with row 9 selected.
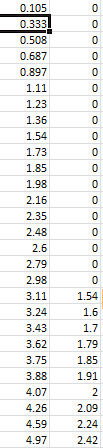
Spreadsheet screenshot with two columns of numbers: the first column ranges from 0.105 to 4.97 and the second column shows mostly 0 values, with non-zero values from 1.54 to 2.42 near the bottom.
 
Last edited:
Avanthica said:
Homework Statement:: draw the graph between the voltage and the current and hence find the dynamic resistance of the diode for both forward and reverse bias condition.
Relevant Equations:: ∆𝑅=∆𝑉/∆𝐼

how to plot these points in the same graph and find the foward biasand reverse bias dynamic resistance for the SILICONE DIODE IN4001
FORWARD BIAS REVERSE BIAS

https://www.physicsforums.com/attachments/270565 https://www.physicsforums.com/attachments/270567
Your attachments are not working. Do they show your work toward the solutions?
 
Avanthica said:
Homework Statement:: draw the graph between the voltage and the current and hence find the dynamic resistance of the diode for both forward and reverse bias condition.
Relevant Equations:: ∆𝑅=∆𝑉/∆𝐼

how to plot these points in the same graph and find the foward biasand reverse bias dynamic resistance for the SILICONE DIODE IN4001
FORWARD BIAS REVERSE BIAS

View attachment 270576 View attachment 270578
Are you asking how to plot both sets of data in one graph? I don't think you are being asked to do that. They’re two separate graphs.
 
haruspex said:
Are you asking how to plot both sets of data in one graph? I don't think you are being asked to do that. They’re two separate graphs.
thank you sir for taking time to respond to my doubt. but sir it is asked to plot both the data's in a single graph. in that case what scale will be suitable to plot the data's. both the data's given are for same silicon diode IN4001
 
berkeman said:
Your attachments are not working. Do they show your work toward the solutions?
It shows the data's for plotting the graph sir
forward bias revrse bias
Spreadsheet table with row numbers 1 to 30 and two columns of values: the first column rises from 0 to 0.601 and the second from 0 to 9.08, with row 9 selected.
Spreadsheet screenshot with two columns of numbers: the left column lists voltages from 0.105 to 4.97 and the right column shows 0 for the first rows, then values rising from 1.54 to 2.42 for the last rows.

is it now working sir?
 
Avanthica said:
it is asked to plot both the data's in a single graph
Not the way I read it: (draw the graph between the voltage and the current and hence find the dynamic resistance of the diode) for both forward and reverse bias condition.
 
haruspex said:
Not the way I read it: (draw the graph between the voltage and the current and hence find the dynamic resistance of the diode) for both forward and reverse bias condition.
Ok sir thank you so much