bcjochim07
- 366
- 0
[SOLVED] Potential Energy Color Contour Question
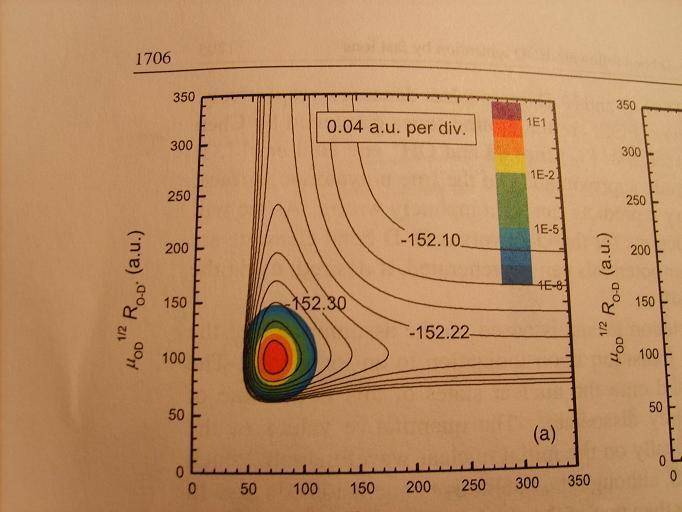
This graph is potential energy contour for deuterated water, HDO. The label on the horizontal axis is the O-H bond length. What I'm wondering is: How can you tell from this graph that the break of the O-H bond is favored of the breaking of the O-D bond?
Homework Statement
This graph is potential energy contour for deuterated water, HDO. The label on the horizontal axis is the O-H bond length. What I'm wondering is: How can you tell from this graph that the break of the O-H bond is favored of the breaking of the O-D bond?