Rectilineal movement of particle

  • Thread starter Thread starter Krokodrile
  • Start date Start date
  • Tags Tags
    Movement Particle
Join the discussion
Ask a follow-up here, or get your own question answered by working scientists, mathematicians and engineers — people, not an autocomplete.
Real named experts · corrections over time · the nuance an AI answer skips
3 replies · 1K views
Krokodrile
Messages
45
Reaction score
3
Homework Statement
consider particles with a motion given by: x= 6t^2-t^3 and make a excel graphic. Obtain maximum velocity, maximum aceleration and maximun displaiment
Relevant Equations
d/dv
I tried to resolve this problem with youtube tutorials help, but, i have a many wrong results. The teacher says that the problem requires critics points, so i know that for that points i need a second grade ecuation, but i don't know how interpreter that points. My results:
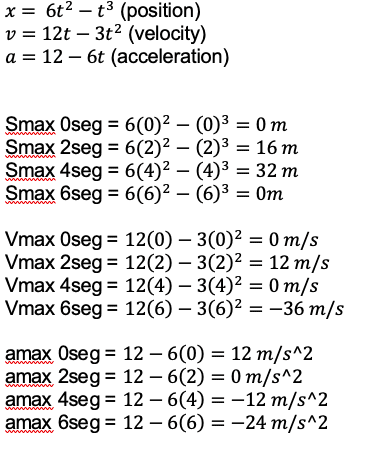
Captura de Pantalla 2021-04-14 a la(s) 3.16.08.png
PD: I don't know how make a MRU graphic in excel.
 
Physics news on Phys.org
It is not clear to me whether you are asked to obtain the answers by means of a graph, or whether you are supposed to use algebra and the graph is extra.
For each of the three maxima you are asked for, you have the right answers in your samples. But that is unreliable - you have no easy way to see whether higher values might occur elsewhere.
To get these algebraically you have to do the following:
- find local extrema by taking the derivative to be zero; e.g. for max displacement look for when its derivative (the velocity) is zero. 12t-3t2=0, t=4, x=32.
- check which extrema are maxima, not minima
- check whether a boundary value (in this case only t=0) gives a greater value than the local maxima.
 
Last edited:
haruspex said:
It is not clear to me whether you are asked to obtain the answers by means of a graph, or whether you are supposed to use algebra and the graph is extra.
For each of the three maxima you are asked for, you have the right answers in your samples. But that is unreliable - you have no easy way to see whether higher values might occur elsewhere.
To get these algebraically you have to do the following:
- find local extrema by taking the derivative to be zero; e.g. for max displacement look for when its derivative (the velocity) is zero. 12t-3t2=0, t=4, x=32.
- check which extrema are maxima, not minima
- check whether a boundary value (in this case only t=0) gives a greater value than the local maxima.
I have to make three extra graphics, i suposed that is time vs velocity, aceleration and position.
yes, i see in a basic hand graphic that local extreme its maxima. I have a question about the x=32, ¿how? i know how obtain t=4 but not that 32.
The teacher mencionated that something curious is happening with the particle trayectory, so i guess that i can see that in the excel graphic, but i don't know how interprete it.