edge333
- 14
- 0
I have some 3-D model output for a river system that is tidally forced at the entrance. Right now, I'm trying to perform some linear regression on the harmonic constants of various tidal constituents at for several locations along the river compared to the observed tidal data. A linear regression of the model vs. observed tidal amplitudes is straightforward but how would you do a similar OLS regression of the tidal phases if they are cyclical (phase wraps)?
For example, say the downstream station 1 (S1) M2 tide has an observed phase of 230 degrees and a modeled phase of 240 degrees but the upstream station 5 (S5) M2 tide has an observed phase of 358 degrees and the a modeled phase of 3 degrees. Obviously the S5 regression point will appear as an outlier even the the phase difference is truly 5 degrees.
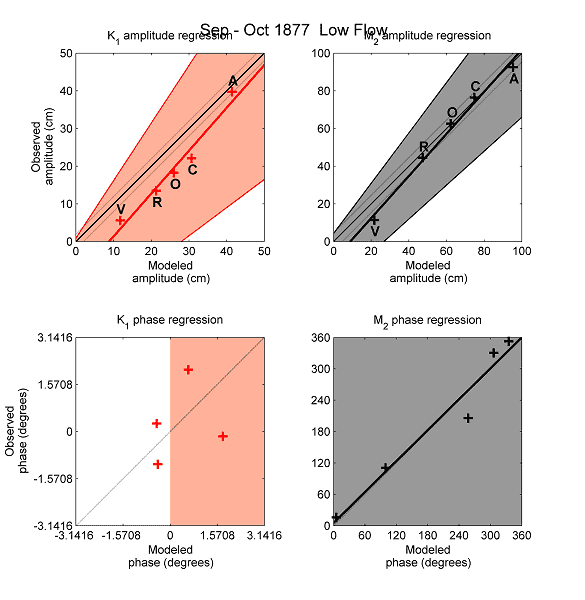
The third plot (bottom left) are phases plotted using tangent with domain -pi < theta < pi
I thought about adjusting all of the phases by subtracting the minimum phase of the observed data (x-value to 0) but that may not fix the problem if the difference between observed and modeled phase of one station is greater than that minimum value.
Can I transform the phases into some phase difference? I attempted to just take the cosine(phase) but that restricts the phases to a domain of -1 to 1 where cosine(90) and cosine(270) both give me 0. Is there a way to use four-quadrant tangent technique? There must be some non-linear OLS model to apply to the phase. How would I get confidence intervals and R values?
For example, say the downstream station 1 (S1) M2 tide has an observed phase of 230 degrees and a modeled phase of 240 degrees but the upstream station 5 (S5) M2 tide has an observed phase of 358 degrees and the a modeled phase of 3 degrees. Obviously the S5 regression point will appear as an outlier even the the phase difference is truly 5 degrees.
The third plot (bottom left) are phases plotted using tangent with domain -pi < theta < pi
I thought about adjusting all of the phases by subtracting the minimum phase of the observed data (x-value to 0) but that may not fix the problem if the difference between observed and modeled phase of one station is greater than that minimum value.
Can I transform the phases into some phase difference? I attempted to just take the cosine(phase) but that restricts the phases to a domain of -1 to 1 where cosine(90) and cosine(270) both give me 0. Is there a way to use four-quadrant tangent technique? There must be some non-linear OLS model to apply to the phase. How would I get confidence intervals and R values?
Last edited: