gmm
- 4
- 0
9121. Problem

If we assume that the initial voltage, Vs, is equal to zero, and it rises to five volts at t = 0, derive an expression for the voltage across the capacitor as a function of time. That is, calculate Vc(t)
2. Homework Equations

this is a series RLC so I'm trying to calculate for Vc(t). Also I used α=R/2L
3. Attempt at solving
L= 120 *10^-6 H
C=0.01 *10^-6 F
R= 33 Ω
ωo=1/√(120*.01*10^-12)=912,870
α=33/(2*120*10^-6)= 137,500
α<ωo ∴ this is under-damped
ωd=√(912,870^2 - 137,500^2)=902,456
D1=(0-5)V... because voltage across capacitor at t=0 is 0V
D2=(0 + 137500[0 - 5])/902456= -0.7618... the current and the voltage through the capacitor at t=0 are both zero, because the inductor does not allow the current to change instantaneously.
With this I built my Total
Vc(t) = e^(-137500t)*(-5cos(902456t) - .7618sin(902456t)) + 5
I then simulated the circuit in Multisim with a square wave voltage source of 0 to 5 V.
the transient analysis shows that when the voltage source goes from 0 to 5V the peak voltage at the capacitor goes up to about 8.5V Here is the plot, and a zoom into the first pulse.
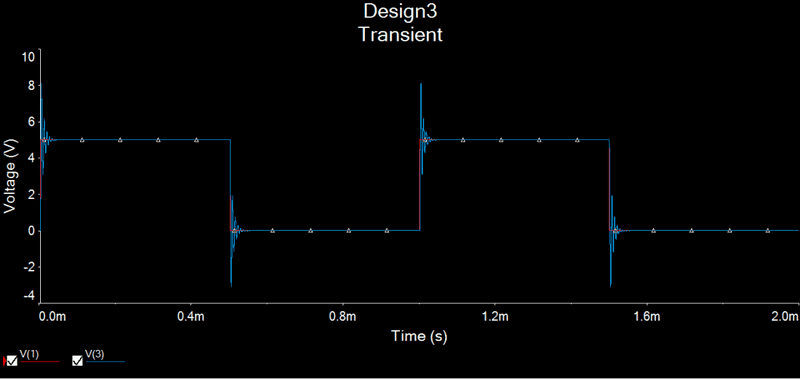
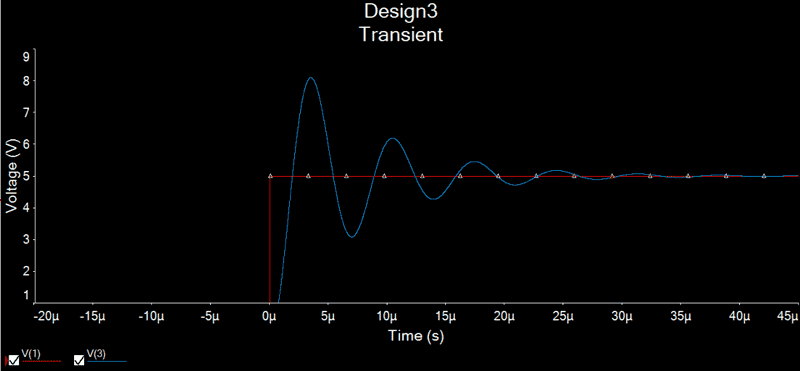
The red is the Source voltage and the blue is the capacitor voltage.
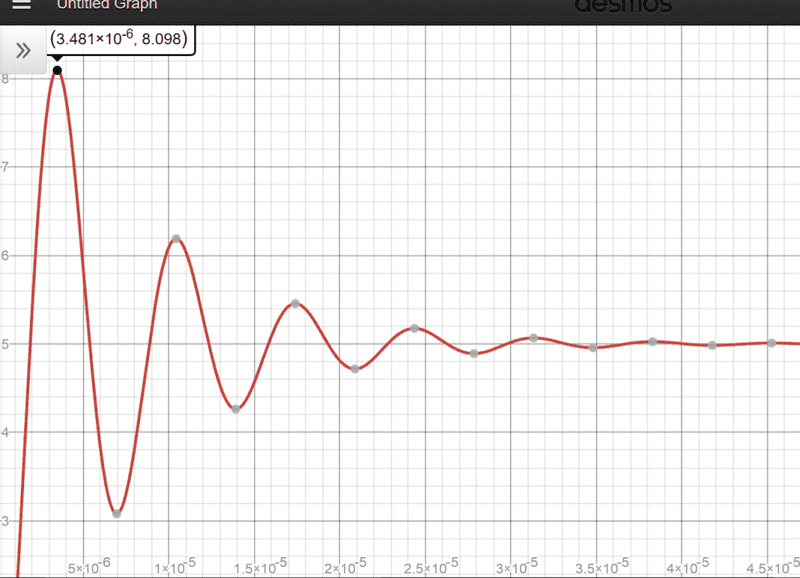
when I plot my Vc(t) it does not resemble this, it gives a lower peak capacitor voltage, Did i mess up in some of the parameters?? Am I missing something?
Attached Files:
If we assume that the initial voltage, Vs, is equal to zero, and it rises to five volts at t = 0, derive an expression for the voltage across the capacitor as a function of time. That is, calculate Vc(t)
2. Homework Equations
this is a series RLC so I'm trying to calculate for Vc(t). Also I used α=R/2L
3. Attempt at solving
L= 120 *10^-6 H
C=0.01 *10^-6 F
R= 33 Ω
ωo=1/√(120*.01*10^-12)=912,870
α=33/(2*120*10^-6)= 137,500
α<ωo ∴ this is under-damped
ωd=√(912,870^2 - 137,500^2)=902,456
D1=(0-5)V... because voltage across capacitor at t=0 is 0V
D2=(0 + 137500[0 - 5])/902456= -0.7618... the current and the voltage through the capacitor at t=0 are both zero, because the inductor does not allow the current to change instantaneously.
With this I built my Total
Vc(t) = e^(-137500t)*(-5cos(902456t) - .7618sin(902456t)) + 5
I then simulated the circuit in Multisim with a square wave voltage source of 0 to 5 V.
the transient analysis shows that when the voltage source goes from 0 to 5V the peak voltage at the capacitor goes up to about 8.5V Here is the plot, and a zoom into the first pulse.
The red is the Source voltage and the blue is the capacitor voltage.
when I plot my Vc(t) it does not resemble this, it gives a lower peak capacitor voltage, Did i mess up in some of the parameters?? Am I missing something?
Attached Files: