Solving Linear Programming Problems Graphically

Click For Summary

Discussion Overview

The discussion revolves around solving a linear programming problem graphically, focusing on the formulation of constraints and the graphical representation of the feasible region. Participants explore the implications of their graphical interpretations and seek to identify the optimal solution based on their drawings.

Discussion Character

  • Exploratory
  • Technical explanation
  • Debate/contested
  • Mathematical reasoning

Main Points Raised

  • One participant presents a linear programming problem and describes their attempt to graph the constraints, noting potential confusion regarding the lines drawn.
  • Several participants point out that the line drawn by the original poster was incorrectly labeled as $2x+y=2$ instead of $2x-y=2$.
  • Participants discuss the correct points to plot for the line $2x-y=2$, with some suggesting values for $y$ to find corresponding $x$ values.
  • There is a suggestion that the optimal solution might be at the point $C(4,0)$ based on the graphical representation, although this is not universally accepted.
  • Participants express a desire to formalize their findings, contrasting graphical methods with the simplex tableau method for solving linear programming problems.

Areas of Agreement / Disagreement

Participants generally agree on the identification of the incorrect line in the initial drawing, but there is uncertainty regarding the optimal solution and how to formally explain it. The discussion remains unresolved regarding the optimal solution and the formal method of explanation.

Contextual Notes

There are limitations in the discussion regarding the assumptions made about the graphical representation and the dependence on the accuracy of the plotted lines. The optimal solution is not definitively established, and the discussion reflects various interpretations of the graphical method.

Who May Find This Useful

Individuals interested in linear programming, graphical methods of optimization, and those seeking to understand the nuances of constraint representation may find this discussion beneficial.

evinda
Gold Member
MHB
Messages
3,741
Reaction score
0
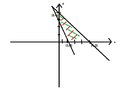
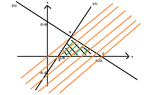
The following linear programming problem is given and I want to solve it graphically.

$$\max (x-y) \\ x+y \leq 4 \\ 2x-y \geq 2 \\ x,y \geq 0$$

I have drawed the lines :

$$(\ell_1) x+y=4 \\ (\ell_2) 2x-y=2 \\ (\ell_3) x=0 \\ (\ell_4) y=0$$

as follows:

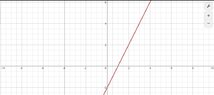
View attachment 5092I have drawed the line $2x-y=0$ taking into consideration the following:

For $y=0 \Rightarrow x=1$ and for $y=2 \Rightarrow x=\frac{1}{2}$.But I found that this is the graph of $2x-y=2$ :View attachment 5093

So are the points that I have found above wrong? Or where is my mistake? (Thinking)
 

Attachments

  • gr22.png
    gr22.png
    3.6 KB · Views: 131
  • gr44.JPG
    gr44.JPG
    39.7 KB · Views: 130
Physics news on Phys.org
Hey evinda! (Smile)

In your drawing you have the line $2x+y=2$ instead of the line $2x-y=2$. :eek:
 
I like Serena said:
Hey evinda! (Smile)

In your drawing you have the line $2x+y=2$ instead of the line $2x-y=2$. :eek:

If we take pick $y=0$ we get $x=1$ and if we pick $y=2$ we get $x=2$.

Then we would get a line like this:
View attachment 5094

But picking $y=-2 \Rightarrow x=0$ and $y=1 \Rightarrow x=\frac{3}{2}$ we get a line as below:

View attachment 5095

Or am I wrong? (Thinking)
 

Attachments

  • l1.png
    l1.png
    328 bytes · Views: 103
  • l2.png
    l2.png
    311 bytes · Views: 131
Your first line is for $2x+y=2$ while the second is for $2x-y=2$.
It should be like the second.

Note that if we substitute $y=2$ in $2x-y=2$, we get $-2=2$.
 
I like Serena said:
Your first line is for $2x+y=2$ while the second is for $2x-y=2$.
It should be like the second.

Note that if we substitute $y=2$ in $2x-y=2$, we get $-2=2$.

Yes, I noticed it too now... I am sorry... Thank you! (Smile)

I will try to find now the optimal solution...
 
We also draw at the same graph the line $x-y=0$.
We consider the line $x-y=\lambda, \lambda>0$ where $\lambda$ is increasing.

View attachment 5096

Do we deduce from the graph that the optimal solution is $C(4,0)$ since it is the last line? (Thinking)
 

Attachments

  • fre.png
    fre.png
    8.4 KB · Views: 121
evinda said:
Do we deduce from the graph that the optimal solution is $C(4,0)$ since it is the last line? (Thinking)

Yep. (Nod)
 
I like Serena said:
Yep. (Nod)

Nice...And how could we explain it more formally? (Thinking)
 
evinda said:
Nice...And how could we explain it more formally? (Thinking)

Erm... I believe that for the graphical method this is pretty much it.
The formal method is with a simplex tableau. (Emo)
 
  • #10
I like Serena said:
Erm... I believe that for the graphical method this is pretty much it.
The formal method is with a simplex tableau. (Emo)

A ok... Thanks a lot! (Smirk)
 

Similar threads

  • · Replies 11 ·
Replies
11
Views
3K
  • · Replies 1 ·
Replies
1
Views
2K
  • · Replies 1 ·
Replies
1
Views
2K
  • · Replies 2 ·
Replies
2
Views
2K
  • · Replies 4 ·
Replies
4
Views
2K
  • · Replies 6 ·
Replies
6
Views
5K
  • · Replies 1 ·
Replies
1
Views
2K
  • · Replies 5 ·
Replies
5
Views
2K
  • · Replies 10 ·
Replies
10
Views
3K