Discussion Overview
The discussion revolves around creating a TikZ graph for the function \( e^{(x^2-1)^2} - 2 \). Participants explore various aspects of graphing, including domain and range settings, axis formatting, and the inclusion of additional features such as the second derivative graph. The conversation includes technical details about TikZ syntax and the use of the pgfplots package.
Discussion Character
- Technical explanation
- Exploratory
- Debate/contested
Main Points Raised
- One participant expresses difficulty in achieving the desired graph format, mentioning the need for equal domain and range and normal axis lines.
- Another participant suggests corrections to the TikZ code, including the use of the pgfplots package and adjustments to the axis properties.
- There is a proposal to modify the function to \( (e^{(x^2-1)})^2 - 2 \) or \( e^{(x^2-1)^2} - 2 \) based on the intended graph.
- Participants discuss how to limit the domain to avoid large values when graphing the function, suggesting a range of -1.5 to 1.5.
- One participant inquires about customizing tick marks on the x-axis to only appear at zeros, indicating a desire for a specific visual style.
- Another participant shares their experience with calculating zeros outside of TikZ and mentions the utility of letting TikZ handle some calculations.
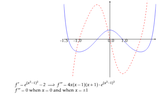
- A participant attempts to graph the second derivative of the function but encounters issues with TikZ syntax, leading to confusion about the correct representation.
- There is a clarification regarding the first derivative and its representation in TikZ, with a successful example provided for both the original function and its second derivative.
Areas of Agreement / Disagreement
Participants express various preferences and suggestions regarding the graphing approach, but no consensus is reached on a single method or formula. There are multiple competing views on how to format the graph and which function to use.
Contextual Notes
Some participants mention limitations related to the rendering of TikZ code and the need for specific adjustments to achieve the desired graph appearance. There are unresolved questions about the best practices for graphing derivatives and handling large values in the function.
Who May Find This Useful
This discussion may be useful for individuals interested in using TikZ for graphing mathematical functions, particularly those looking to customize their graphs or explore advanced features of the pgfplots package.